

How Lockdowns Changed Consumer Spending
Five years ago, the pandemic flipped the world on its head and with it, our financial systems, habits, and priorities. Lockdowns, global supply disruptions, and shifting interest rates reshaped economies everywhere. For South Africans, the way we spend has changed profoundly.
Since March 2020, when SA entered lockdown, we’ve seen some fascinating transformations in how money moves through households. And with that change comes opportunity, new behaviours, emerging trends, and the chance to understand what’s really driving consumer decisions today.
So, what does this new landscape look like? Let’s unpack..
The Essential Spend
Groceries, Medical expenses, house and rent expenses, home and utility, as well as transport and fuel, make up the 5 categories we analysed as essential spending.
The Reign of Groceries
In 2019, rent was the biggest essential expense for South African households. But in the years that followed, groceries surged ahead to claim the top spot. Between 2019 and 2024, average annual grocery spend jumped by 69%, far outpacing rent, which rose by just 21%.

This shift closely mirrors inflation trends. In 2020, CPI hit a low of 3.3%, but by 2022 it peaked at 6.9%, driven largely by rising costs in food and non-alcoholic beverages, along with housing and utilities (StatsSA). Groceries, once a stable category, became a standout driver of essential expenses, and this proves that when it comes to essentials, where one lives is the easiest place to cut expenses when prices go up fast.
Interestingly, by 2024, as inflation eased to 4.4%, grocery spend finally dipped slightly—a small but notable reversal in the trend.

Grocery Spend Hits Harder at the Bottom
While high-income households still spend the most on groceries in absolute terms, with a 28% increase from 2019 to 2024, it’s low-income households that have felt the sharpest impact.
For many South Africans in the lower income bracket, groceries have become significantly more expensive, with average annual spend soaring by 88% over five years. Medium-income households also saw a steep rise at 48%.

Meanwhile, rent continues to dominate essential expenses for both medium- and low-income groups, highlighting how rising food costs are squeezing budgets already stretched by housing.
The Non-Essentials
Non-essential spending habits vary across income groups, but one trend cuts through them all: a sharp rise in spending on loans and insurance.
Across the board, households are pulling back on home and garden upgrades – and saving less than they used to. The post-COVID financial reshuffle is showing up clearly here, with more money going toward managing risk and debt, and less toward future-focused or lifestyle spending.
High-Income Habits Are Shifting
Before 2023, high-income households were big spenders on home and garden improvements. But priorities have shifted. Since the pandemic’s onset in 2020, spending has leaned heavily toward loans and insurance, by 2024, these had become the top two non-essential expenses in this group.
The post-COVID travel boom also lost steam. Holidays and travel, once the second-biggest category, dropped to fourth. Eating out and takeaways now sit in fifth, with both seeing declines from 2023 to 2024.

There are a few standout exceptions. Coffee, pet care, and especially tech and appliances have held their ground – or even surged. Tech spend alone climbed by a third in just one year, signalling an ongoing appetite for connected, convenience-driven lifestyles.
Middle-Income Households Reprioritise
For the middle-income group, loans and insurance now dominate non-essential spending, overtaking savings, home improvements, and travel, which led the pack in 2019.

Eating out and entertainment have also taken a hit since 2023. And while high-income earners kept spending on tech, middle-income households hit pause after a post-COVID splurge in 2022. The result? A clear shift from aspirational to practical spending, as financial caution takes centre stage.
Low-Income Households Feel the Pinch, Shift Priorities
After the pandemic, low-income households jumped at the chance to travel, but by 2024, holiday spending had tapered off. Home and garden expenses, once a key category in 2019, dropped to fifth place.

What’s taken over? Loans now dominate spending, followed closely by insurance. These two categories have surged, reflecting a broader move toward financial protection and debt servicing. Meanwhile, alcohol spending dipped in 2024, while coffee spending continued to climb.
Tech and appliance spending has remained mostly flat since its peak during the 2020 lockdowns. However, there’s been a noticeable uptick in software and services, possibly mobile data and digital tools, as connectivity becomes even more essential. And in a heartening twist, pet care spending is up, too, showing that even in tighter times, people are still making space for the things they love.
Trends Across Income Groups
Tech spend stumbles, recovers
Tech and appliance spend has been a strong performer over the past five years, until 2023, when it took a noticeable dip. But the pause didn’t last long. By 2024, spending had bounced back, reaffirming the category’s role as a priority across all income brackets.

While the chart tells the full story, the trend is clear: when it comes to tech, South Africans may slow down, but they rarely stop.
Alcohol Slips as Tastes Shift
Alcohol spending enjoyed a brief post-COVID-19 rebound, rising 20% in 2021, but that momentum didn’t last. Since 2022, it’s been on a steady decline, with a 5% drop across all income groups in 2024 alone.

This isn’t just a blip, it’s a signal. Consumer appetite for alcohol appears to be shifting, and big players like Heineken are already hedging bets by pouring investment into non-alcoholic alternatives. Globally, the non-alcoholic drinks market is valued at $1.3 trillion and is set to more than double in the next decade.
Driving this trend? A mix of health awareness and cultural shifts, especially among Gen Z, who are far more likely to go teetotal than previous generations. For retailers, this doesn’t spell disaster. Consumers aren’t quitting beverages; they’re just choosing differently. But the long-term impact on sin tax revenues and the viability of alcohol-only retailers could be worth watching closely.
Coffee on the Climb
While alcohol spending slips, coffee continues to rise though at a slightly slower pace. Since 2020, coffee spending has surged by an incredible 168%, peaking in 2023 before easing slightly in 2024.

What’s striking is the narrowing gap between coffee and alcohol. In 2023, alcohol spending was triple that of coffee. By 2024, it was just double. The shift suggests more than just changing preferences — it signals a generational reset.
Gen Z is leading the charge. Not only are they drinking less alcohol, they’re picking up coffee younger than any previous generation, often by age 15, compared to Millennials, who typically started in their late teens. This early adoption hints at a long runway of growth still to come

Insurance and Loans Surge, Then Settle
Right after COVID hit, spending on insurance spiked across all income groups, an immediate response to uncertainty. That upward trend has continued year after year, but like many other categories, growth is beginning to slow as we move into 2024.

It’s a classic post-crisis pattern: a rush to safeguard against risk, followed by a gradual normalisation. Still, the elevated baseline suggests insurance has cemented itself as a priority in the new consumer landscape.
The Overall Landscape Shifts
Of all the spending categories reshaped by the post-COVID world, loans and insurance saw the biggest gains. By 2024, average annual spend on loans was up 68% compared to 2019, while insurance climbed 60%.

Close behind were more lifestyle-driven categories, eating out (+54%) and clothing (+56%), reflecting a cautious return to discretionary spending. And while personal care started from a smaller base, it nearly doubled, rising by 92%.
The message is clear: South Africans are balancing risk, debt, and a desire for normalcy, reshaping household priorities in the process.
To Conclude
Essentials spending remains dominant, but there is growing sensitivity to price. Consumers, particularly in low-income households, are becoming far more selective about where and how they spend on groceries. Inflation has placed sustained pressure on household budgets, and although essential spending holds steady, the way consumers approach these purchases is changing. Value, promotions, and perceived necessity are more important drivers than before.
The rise in loans and insurance spending points to a consumer mindset shaped by uncertainty. Across income groups, people are prioritising financial protection and stability over discretionary spending. This shift suggests a longer-term caution in household financial behaviour, where managing risk and covering obligations take precedence over saving or lifestyle upgrades.
Coffee continues to grow as a daily ritual, particularly among younger generations. What was once considered an occasional indulgence has become a regular, habitual purchase. This points to a broader cultural change where coffee is not only replacing other discretionary treats but becoming an identity marker, much like technology or fashion once were for previous generations.
Alcohol spending is on a steady decline, and the trend appears structural rather than temporary. Health consciousness, changing social norms, and the rise of non-alcoholic alternatives are all contributing to a gradual shift away from traditional alcohol consumption. This shift is especially visible among Gen Z, where sober curiosity and moderation are far more common than in older generations.
Tech spending, after a brief slowdown in 2023, recovered strongly in 2024. This rebound shows that digital connectivity, convenience, and access to technology remain high priorities, even when budgets tighten. Technology is no longer viewed as a luxury — it is woven into everyday life, across work, education, entertainment, and social connection.
Rent costs have grown modestly compared to other essentials over the past five years. However, this may be a temporary pause rather than a long-term trend. As interest rates ease and the economy continues to stabilise, housing costs, particularly rent in urban centres, could rise again. This potential rebound would add new pressure on household budgets and shift spending dynamics once more.
These shifts in the consumer landscape point to a South African market that is evolving, not shrinking. As habits change and new priorities emerge, there are more opportunities than ever to meet consumers where they are and build lasting relationships. Understanding these patterns is the first step toward unlocking new growth.
If you’d like to explore any of these trends in more detail or run a deep dive into a specific category, the team at Reveal is ready to help. Reach out to us by replying to this email — we’d love to work with you!
Until next time,
Reveal

Breaking Down a R1.14 Gambling Trillion Industry
South Africa’s gambling industry has undergone a seismic shift over the past two decades. Once limited to casinos and the National Lottery, the sector exploded in scale and accessibility following the 2004 National Gambling Act, which legalised sports betting beyond horse racing and laid the groundwork for online gambling.
Today, gambling is deeply woven into South African consumer behaviour, with the industry hitting R1.14 trillion in turnover in 2023/2024—and sports betting alone contributing R761 billion, or 66.6% of the total market.

But just how embedded is gambling in South African spending habits? Our recently improved dataset now features more than 640 000 unique South Africans and continues to grow everyday. Within this dataset, a staggering 204 289 unique individuals placed deposits with an online betting company between August 2023 and January 2025—accounting for nearly 30% of all users analysed.
And that’s likely an underestimate, as it excludes voucher-based deposits (such as FNB’s 1voucher system) and cash deposits at branded kiosks. As our dataset comprises roughly 2% of all South Africans with bank accounts, seeing 30% of these active in the gambling space could mean as much as 10 million South Africans have participated in the industry.
With such a significant portion of the population engaged in online betting, the question isn’t just how much money is being wagered but rather who is betting, where they are betting, and how engaging with betting affects their overall spending decisions.
This month, we analyse deposit transactions across major gambling providers and the National Lottery, breaking down the trends, demographics, and behavioural shifts shaping South Africa’s growing gambling economy.
The Growth: Gambling on the Rise
Our data reveals that the gambling sector continues to expand at an exceptional pace. Looking at the differences between December 2023 and December 2024, we find that the 10 largest online bookmakers recorded a 32% year-on-year growth rate in deposit value and an exceptional 43% year-on-year growth rate in total deposits. For comparison, the National Lottery saw a 13% year-on-year growth rate in total deposits over the same period.

The Market Players: Who’s Playing and How Much Are They Spending?
From the graph below, it’s evident that the National Lottery is still the dominant way in which South Africans gamble, with more than 33% of gamblers in our dataset having bought at least one Lotto ticket within the analysis timeframe. This means that they have 48% more unique customers in our dataset than the closest online gambling competitor - Betway - who managed to capture the spend of almost 23% of all unique gamblers in our dataset. Hollywoodbets closes out the top three, with a 21.7% market share.

However, when looking at the total number of deposit transactions made, a very different picture emerges. The National Lottery only accounts for 19.2% of all deposit volumes over the period of analysis. Hollywoodbets is the dominant player by some distance - managing to capture an incredible 40% of all transactions made over the period of analysis. Betway trails its biggest competitor by some distance, capturing just over 24% of the market by deposit volume.

However, it should be noted that National Lottery players aren’t big gamblers. Our data reveals that, despite having one of the highest average monthly incomes (almost R21 000), the average National Lottery player only bets just R48.85 per deposit. This is by far the smallest average deposit size of all the merchants analysed. The next smallest average deposit size was Easybet at R146.22 (almost 3 times the size of the National Lottery). National Lottery players also deposit significantly less frequently than the players at the major online bookmakers.
Looking at this data, it becomes apparent that the Lotto players are more casual in their engagement—tending to wager small, infrequent amounts as opposed to more frequent and larger deposits seen at the online bookmakers. That being said, a big growth opportunity for gambling providers could be converting casual National Lottery players into more active gamblers.

Looking more specifically at the online bookmakers themselves, it becomes clear that there is segmentation of customer bases along the lines of income. SunBet - who has the highest income earning average customer at R21 229 - has positioned itself as a platform for high-rollers, SunBet are likely converting existing casino customers into online sports bettors. Their customers’ deposit sizes are significantly higher than those of any of the other bookmakers analysed, hinting that traditional casino gamblers are transitioning onto digital betting platforms with substantial stakes.

This notion of SunBet attracting larger, more risk-seeking punters is further cemented when looking at the relationship between how its average (mean) player bets on a monthly basis relative to its median player. You can see from the graph below that SunBet’s average customer bets more on a monthly basis (R3 111) than any other bookmaker’s average player. However, the median spend at SunBet is significantly lower at R200 - which places it in the middle of the pack of the merchants analysed. This large divergence between the mean and median monthly spend suggests that SunBet have managed to capture the attention of serious punters whose large wager sizes have skewed the mean. The implication here is that SunBets currently makes the majority of its revenue from these larger ‘whale’-like players.

Unsurprisingly, the retention and continued loyalty of these players will be at the top of SunBet executives' minds, which may have led to the rollout of its Sun MVG Loyalty Programme. This programme allows online punters to earn points for betting and exchange these points for in-person experience rewards at one of the many Sun International’s casinos and hotels. Cleverly, this allows SunBet to leverage one of its true differentiators among its online bookmaker peers - its holding company’s brick-and-mortar hospitality offering.
Yesplay and Hollywoodbets, on the other hand, have firmly established themselves among earners who earn less than R16 000. These players tend to make smaller deposits but on a far more frequent basis than their higher-earning peers. However, this is where the similarities end—Hollywoodbets is the clear market leader in all aspects, whilst Yesplay is consistently toward the bottom end of the pack of the bookmakers analysed.
Hollywoodbets has the second highest mean spend per customer per month (R3 092) of all the bookmakers analysed. However, unlike SunBets, it enjoys the highest median spend of any of the bookmakers. In fact, Hollywoodbets’ median spend is 28% more than its closest peer on this metric - Lottostar. This suggests that there may be a structural difference between Hollywoodbets and the rest of the market as it appears to enjoy broad appeal by smaller and more prominent players alike. It is consistently best-in-class across the majority of metrics we analysed.
When Are South Africans Gambling? Weekend vs. Weekday Trends
According to the National Gambling Board data, sports betting accounts for 66.6% of all gambling activity, compared to casinos, which account for 26%. Therefore, deposits are expected to follow a cyclical pattern around weekends, when most of the premium sports fixtures take place. Our data confirms this.
We analysed the weekly deposit pattern of Betway customers, looking at both frequency and value of deposits by day of the week:
- On average, deposit value increases gradually throughout the working week and peaks on Friday before dropping rapidly over the weekend. Looking at the graph below, more than 17% of all deposit value at Betway over the period of analysis occurred on Friday.
- The frequency of deposits, on average, follow a similar pattern as above - also peaking on a Friday and then rapidly dropping off by Sunday.
- This pattern changes somewhat when looking at the total number of unique customers who deposited by day of the week. Saturdays, on average, had the most unique punters over the time period of our analysis.

This seems to suggest that there is a two-tier betting economy happening throughout the week at Betway:
- Habitual, larger stake bettors are more likely to deposit strategically earlier in the week. Many may be looking to leverage the regular day-of-the-week deposit promotions at Betway - such as Top Up Tuesday or Freebie Friday. These promotions offer punters a mechanism through which they can increase their stake size by depositing on certain days of the week.
- More casual, infrequent players are more likely to deposit over the weekend, perhaps in anticipation of a large sporting event after succumbing to the weekend hype.
Who’s Betting? A Look at Age Groups
The age profile of South African gamblers varies significantly across platforms, reflecting different marketing strategies, brand positioning, and customer preferences. It is important to note that our underlying dataset does skew younger, with the majority of people being between 25 and 45. However, there are still some interesting variations across bookmakers' customer base by age.
Betway has captured a younger audience, likely driven by its high-visibility sponsorships in major sports leagues and strong digital presence. By aligning with popular sporting events and mobile-first engagement strategies, Betway has positioned itself as the go-to platform for younger, digitally native bettors.

Unsurprisingly, SunBet appeals to an older demographic, many of whom are long-time casino players transitioning to online betting. Lottostar also appears to appeal to an older demographic than Yesplay or Hollywoodbets.
Meanwhile, the National Lottery maintains a broad customer base but trends toward an older demographic, reflecting its longstanding presence in South African gambling culture. Unlike sports betting, which relies on real-time engagement and game-specific wagering, the lottery’s appeal remains rooted in tradition and the allure of life-changing jackpots.
This demographic split underscores a significant shift in South Africa’s gambling industry. Sports betting is expanding beyond its traditional audience, bringing in younger, mobile-first consumers who may not have previously engaged with gambling. This trend will likely accelerate as more digital platforms tailor their offerings to new generations of bettors.
How Much of Their Income Are South Africans Betting?
A key question in gambling economics is how much of a person’s income is allocated to betting. Our data suggests that for the majority of players, gambling remains a discretionary entertainment expense rather than a financial risk - but notable differences emerge across merchants and player segments.
As expected, the National Lottery players overwhelmingly deposit less than 1% of their monthly income to play for the chance to win the jackpot. As established above, National Lottery players earn a higher monthly income, on average, than the majority of the online bookmakers players. This indicates that Lottery wagers are largely casual, with small, low-frequency wagers that won’t significantly impact household finances.

For the vast majority of customers at online bookmakers, deposit amounts are less than 1% of their monthly income. This reinforces the idea that betting is a leisure activity rather than a financial burden for the majority of players. However, the online bookmakers do see a significantly larger portion of their customer base depositing more than 1% of the monthly income relative to the National Lottery. Sports betting appears to appeal to a broader range of income groups and behaviours, from occasional bettors placing small, social wagers to high-frequency users engaging in larger transactions. The high-spender segment is evident, particularly among SunBet users, where deposit sizes suggest that some players are engaging in high-stakes betting, possibly mirroring traditional casino gambling behaviour in an online setting.
These insights highlight the industry's dual nature—while most players engage in low-risk gambling, a smaller but significant segment of high-stakes bettors remains, shaping revenue distribution across platforms.
What else are gamblers spending their money on?
We looked deeper into our data to see how gambling might be influencing purchasing behaviour and how this might differ from their non-gambling peers. For this analysis, we have segmented our dataset into two groups:
- Gamblers: Any individual in the dataset who has spent at least R450 (twice the size of the median deposit) collectively and made at least 3 deposits at an online gambling bookmaker during the 2024 calendar year. These filters are used to ensure we capture the purchasing behaviours of more serious gamblers and exclude casual players who may have made a couple of low-value deposits as an experiment.
- Non-gamblers: Everyone else in the dataset. This would include individuals who did not gamble at all in 2024, individuals who played the National Lottery but never placed a bet with an online bookmaker and individuals who made one or two low-stakes bets with an online bookmaker.
We then segmented these two groups again into their respective age cohorts. This is done to control for the effects that age (or life stage) may have on consumer purchasing decisions. We have again bucketed the data into the 4 age groupings seen above:
- 18-25
- 25-35
- 35-55
- 55+
Finally, we use the median spend to assess differences between bettors and non-bettors within age groupings. The median spend has been chosen to negate the effects of extreme spending by a small portion of bettors, which may have an outsized effect on the observed averages.
Gambling and Alcohol Spend
We have looked at how gamblers and non-gamblers spend on alcohol on a monthly basis. For the purposes of this analysis, alcohol spend is defined as any spend made at a liquor store (online or in-store), bar, tavern or any other establishment with clear links to the consumption of alcohol.
Alcohol spend for both bettors and non-bettors increases with age and peaks in the 35-55 age bracket before dropping off at the 55+ age group.
Across all age groupings, the median gambler consistently outspends their non-gambler peers on alcohol. The largest disparity occurs in the 25-35 age group, where the median gambler spends 22% more on alcohol than their non-gambling counterparts.
This pattern suggests that gambling and alcohol consumption may be more closely linked in younger demographics - potentially reflecting social habits driven by sports betting culture, where gambling and social drinking often go hand in hand.
For brands in the alcohol and hospitality sectors, this presents a clear opportunity for cross-promotional partnerships with betting platforms. This is likely particularly true for premium liquor brands, sports bars, and event-based activations. Whether through exclusive betting-linked drink promotions, VIP lounge experiences, or co-branded sports event sponsorships, tapping into this high-spending consumer overlap could prove to be an effective engagement strategy.

Gambling and Cellular Spend
Next, we looked at how gamblers and non-gamblers spend on cellphone and cellphone-related expenses on a monthly basis. For the purposes of this analysis, cellphone-related spend is defined as any spend made on a mobile phone, prepaid airtime and data, a monthly contract with a South African telecommunications company (including MVNOs) or any other merchant that has clear links to selling cellphone accessories or repairs.
Interestingly, cellphone-related spend for both bettors and non-bettors consistently increases with age - peaking for both groups in the highest age bracket (55+). This may be related to the correlation between cellphone-spend and monthly income, with older individuals in the dataset earning more, on average, than their younger peers.
Across all age groupings, the median gambler consistently outspends their non-gambler peers on cellular-related spend. The most significant disparity occurs among the youngest age (18-25) group, where the median gambler spends a massive 56% more a month on mobile-related expenditure than their non-gambling counterparts.

On the surface, this finding is unsurprising, considering most of these bookmakers are primarily online-first businesses, and the majority of South Africans would be accessing their sites via mobile phones. However, the rise of data-free technology and its adoption by major online bookmakers, including Betway and Hollywoodbets, may challenge this implicit logic in the future. The data-free versions of their websites are simpler but allow the player to access all the key features - including viewing odds, depositing money, u bets and withdrawing money.
For gambling operators, this may present a clear opportunity to partner with mobile service providers to offer engagement promotions and loyalty programmes with mobile data as the core offering. These partnerships could enhance user accessibility, reduce friction in engagement, and solidify mobile as the primary gateway for betting activity in this demographic.
Gambling and Eating Out
Next, we analyse how gamblers and non-gamblers spend on eating out on a monthly basis. For the purposes of this analysis, eating out expenditure is defined as any spend made dining at a restaurant, quick-service restaurants (QSRs), or ordering from a meal delivery service such as Uber Eats.
Interestingly, eating-out expenditure peaks for both bettors and non-bettors in the 25-35 age group. It then declines gradually among older individuals in the dataset. This may relate to the fact that individuals in the 25-35 age bracket, on average, have fewer dependents to support and fewer financed assets to repay.
It is striking the degree to which bettors outspend their non-betting peers as it relates to eating out for every age group. Much like the cellphone expenditure, the largest disparity occurs among the youngest age (18-25) group, where the median gambler spends a massive 52% more a month on eating out than their non-gambling counterparts.

This trend suggests that younger bettors have higher discretionary spending habits, making restaurants, fast-food chains, and delivery services prime candidates for strategic partnerships with gambling operators. Collaborations such as bet-and-dine promotions, exclusive discounts, or gamified loyalty programs could create a mutually beneficial ecosystem, driving customer acquisition and higher engagement for both industries.
Gambling and Holiday & Travel Spend
Finally, we look at how gamblers and non-gamblers spend on holiday and travel expenses on a monthly basis. For the purposes of this analysis, holiday and travel spend is defined as any expenditure on long-distance travel (local and international airlines, long-haul bus operators, etc., but not Uber trips, trains or taxis), hotels or temporary accommodation, travel agents, and any expenditure expressly related to a holiday.
For the first time in this analysis, the trend of the spend by bettors and non-bettors does not move in tandem. For non-bettors, holiday and travel expenditure increases systematically with age. However, for bettors holiday and travel expenses peak in the 35-55 age category and then show a slight relative decline in the 55+ age bracket.
Unlike the 3 spend categories analysed above, non-bettors consistently outspend their bettor peers across all age brackets. The largest disparity occurs among the oldest age (55+) group, where the median non-gambler spends 26% more a month on enjoying holidays and travel than their gambling counterparts.

Concluding Thoughts
The rapid growth of online gambling in South Africa signals a fundamental shift in consumer behaviour—one where digital accessibility, evolving demographics, and strategic marketing are converging to create a permanently embedded industry. The numbers are clear: sports betting dominates, the betting market exhibits a power law distribution with a few big players accruing the majority of the revenue and high rollers fuel profitability - making loyalty programmes all the more important.
But where is the real growth opportunity? Some platforms, like Yesplay, focus on onboarding more casual players and lower-income earners—their long-term value hinges on whether these users convert into high-value bettors. Meanwhile, SunBet and Lottostar have already outperformed in attracting a wealthier market. This contrast suggests that South African operators face a strategic crossroads: ruthlessly pursue mass adoption with high-volume, low-value bets or spend to acquire top-tier spenders and then go all-in on retaining them.
Regulation will also be a defining factor. With nearly 30% of the dataset transacting with licensed betting companies, the legal framework will need to balance industry expansion with responsible gambling measures. The challenge for regulators will be curbing excessive spending among high-risk users while allowing the sector to continue its rapid growth trajectory.
Another critical battleground is data-driven engagement. With players generating rich transactional data, operators have an opportunity to refine targeting, optimise odds, and drive repeat spending through hyper-personalised promotions. Platforms that successfully integrate AI-driven recommendations and loyalty mechanics will not only increase customer lifetime value but also build stronger brand affinity.
Looking ahead, South Africa’s online gambling market is unlikely to slow down—but where the money flows and who captures the most value remains uncertain. International brands are well-positioned, but local operators have the advantage of market familiarity. Whether the future is defined by high-roller segmentation, mass-market adoption, or regulatory shifts, one thing is certain: this is no longer a niche industry in South Africa—it’s mainstream consumer behaviour.
Understanding consumer behaviour beyond direct gambling transactions is key to identifying new acquisition strategies and high-value partnerships. Cross-market analysis reveals meaningful overlaps in spending habits, such as higher dining and alcohol spend among gamblers or increased mobile data reliance among younger bettors. These insights highlight where and how gambling operators can engage potential customers more effectively—whether through strategic brand partnerships, tailored promotions, or incentive-driven collaborations. By leveraging cross-sector spending trends, operators can move beyond traditional advertising and embed themselves into the broader consumer lifestyle, creating more compelling, high-converting engagement strategies.
That concludes this month’s ShopTalk. For more insights on this industry and others, feel free to contact us by replying to this email.
Until next month,
Reveal Data
The SA Subscription Economy
In 2023, South African e-commerce retailers began introducing subscription services offering free deliveries and added benefits, following the global success of models like Amazon Prime.
A year later, our data reveals fascinating insights bringing us to question just how ready South African consumers are to pay for these monthly subscriptions – do they see value and what does this mean for South African retail strategy?
The Evolution of Retail Subscriptions
Membership-based retail shopping went big during the mid-20th century USA, gaining momentum in 1983 with the introduction of Costco and Sam's Club. Today, Costco's $65 annual membership fee generates a massive $4.8 billion in revenue per annum.
Although the total fees made off its 75 million paid members only represent roughly 2% of its total revenue, its real value lies beyond being a revenue source. Its subscription models allow for Costco to:
- Understand changing consumer preferences in near real-time
- Earn more predictable revenue
- Drive enhanced customer loyalty
- Improve inventory management and logistics
With these benefits, it’s no wonder subscription-based membership models have become a big focus for the most prominent in-store and e-commerce retailers.
In 2025, Amazon launched Prime with a $75 annual “membership fee” for unlimited fast shipping. Today, Prime serves over 180 million subscribing members. With an unchanged annual fee, same-day shipping, and an expanding suite of products and services – it's unsurprising that subscribers now generate +- $24.5 billion for the company annually.
This evolution from simple delivery benefits to comprehensive service bundles offers valuable lessons for South African entities seeking revenue and customer loyalty opportunities.
Let’s dive into the South African subscription space…
South Africa's Subscription Landscape
This behavioural shift is already taking hold in South Africa. While still in its early stages, the subscription retail market is showing real momentum. Checkers Xtra Savings Plus, Uber One, and Takealot More are leading the way, offering customers a mix of free delivery, discounts, and exclusive deals. Even beyond these major players, South African retailers are exploring new subscription-driven strategies, with initiatives like Proudly South African and Digital Retail Africa 2025 pushing for local subscription services to compete with international rivals.
South African consumers seem ready for this shift. The country’s mobile commerce dominance presents a unique opportunity — subscription models integrated with mobile platforms could reach more customers than ever before. At the same time, economic pressures are making value-driven convenience more attractive, giving retailers a powerful way to drive long-term loyalty.
Analysis of the Success of Subscriptions in South Africa
Curious to uncover how membership subscriptions have affected consumer purchasing behaviour in South Africa – we turned to Reveal’s own transaction-level data.
We extracted data on the two most established players in the local subscription space: Uber's UberOne (started June 2023) and Checkers' Xtra Savings Plus (started September 2023).
At a glance, each of these subscriptions offers a distinct value proposition:

In summary, UberOne’s monthly R50 fee provides not only free delivery as long as orders are over R100 but also a 5% discount on rides, while Checkers Xtra Savings Plus' exclusive R99 launch, presents their offering with unlimited delivery perks on orders over R350 in addition to additional offers and savings for subscribers.
The Biggest Spenders Opt-in
Our transaction data reflects expected subscription-linked revenue returns – in both cases, Uber One and Xtra Savings Plus sales volumes originating from customers with subscriptions from January to December 2024 increased.
For customers with an Uber One subscription, the value of their Uber Eats spend increased from 38% to 44% of all Uber Eats spend tracked throughout 2024. This represents a 16% relative spending increase over the year – which is notable considering that Uber One customers only make up about 27% of all customers who made an Uber Eats purchase.
This suggests that not only did Uber One members spend at a greater clip throughout 2024 – each Uber One member, on average in the aggregate, spent 70% more than non-member customers.

For Checkers, compelling insight emerged – our data shows that the revenue from Xtra Saving Plus customers grew to represent 33% of all revenue earned by Checkers. This represents a 50% relative increase in revenue contribution by Xtra Savings Plus members throughout 2024. This is massive considering our data shows that Xtra Savings Plus members only account for about 13% of all customers who shopped at Checkers in 2024. It should be noted the figures quoted above relate to the Checkers brand exclusively and not to the Shoprite Group as a whole.

One might assume that customers who have a strong preference for online purchases and home delivery would be the most likely to adopt a subscription-based Xtra Savings Plus membership. However, data reveals an uptick in spending in-store for Xtra Savings Plus members as well. This might have to do with the in-store benefit offered on Xtra Savings Plus or simply that when a customer is already engaged with a brand through a subscription, they become more likely to default to that retailer across all channels.

Subscription Perks: How Free Delivery Shapes Shopping Habits
South African consumers are highly price-conscious, which makes free delivery a powerful tool for influencing shopping behaviour. The appeal of spending more to save more is clear — but does free delivery actually drive more transactions, or does it simply shift how people shop?
For both Xtra Savings Plus and Uber One, free delivery is unlocked once a minimum spend is reached. The assumption might be that this leads to fewer but larger transactions, as customers try to meet the spending threshold. However, our data shows something different — subscribers aren’t just consolidating purchases to qualify for free delivery; they are shopping more frequently and spending more overall.
Checkers Xtra Savings Plus: More Orders, More Revenue
The Sixty60 Xtra Savings Plus users make, on average, 7.2 transactions per month, compared to 4.4 for non-members. With a minimum spend requirement of R350 per order for free delivery, one might expect customers to consolidate purchases into fewer, higher-value transactions. Yet, our data shows that subscribers continue to place multiple smaller orders, suggesting that free delivery isn’t just saving them money — it’s fundamentally changing how often they shop.

The takeaway? Non-subscribers are paying more for deliveries than they would if they subscribed, losing out on potential savings. At just R99 per month, Xtra Savings Plus offers undeniable value — but this is only an introductory price. With the standard price set to increase to R149 per month, the pricing strategy will likely play a key role in future adoption.

Beyond just savings, Checkers also benefits from more predictable customer behaviour, allowing for better delivery route planning and driver allocation — a win-win for both retailers and customers. As membership numbers grow, so does operational efficiency, reinforcing the long-term viability of the model.
But there’s more to it than just planning deliveries more effectively. Checkers’ Sixty60 delivery drivers earn fixed daily wages, meaning the cost to the company remains the same regardless of how many deliveries each driver completes. By increasing the number of deliveries per driver through a subscription model, Checkers lowers its per-delivery cost, making the overall system more efficient and financially sustainable. This means that as Xtra Savings Plus membership grows, Checkers isn’t just generating more revenue — it’s making its logistics more cost-effective, ensuring long-term profitability.

The growth in spending among Xtra Savings Plus members is driven by two key factors: more customers signing up for the subscription and existing subscribers shopping more frequently. As the subscriber base expands, Checkers benefits from both predictable revenue and increased transaction volume per member — a combination that reinforces long-term customer retention.
Uber One : A Substantial Increase in Order Volumes
Uber One members place an average of 12 orders per month, compared to 4.5 for non-members — that’s nearly three times as many transactions. With an average order value of just under R140, this suggests that Uber One members are frequent users of the platform for small, convenience-based purchases.


*delivery fees vary based on distance, time of day and other factors.
For high-frequency users, the R50 subscription cost easily pays for itself, saving members around R130 per month in delivery fees alone. But there’s more to this than just free delivery.

Uber’s dynamic pricing and personalised promotions help balance the financial impact of offering free deliveries. By encouraging frequent, repeat purchases, Uber can offset the lower margins per transaction with an overall increase in customer spending.
Additionally, members who no longer have to factor in delivery fees may be less price-sensitive and increasing overall spend.
This makes them more likely to spend on higher-margin items, bundles, or last-minute add-ons — more loyalty and more room to play with margins.
Uber vs Checkers Models
However, Uber Eats faces a different challenge than Checkers. Unlike Checkers, which pays delivery drivers a fixed daily wage, Uber pays its drivers per trip. This means that while more transactions increase revenue, they also raise operating costs. To ensure that subscription-based free deliveries don’t eat into margins, Uber offsets these costs in two key ways:
- Higher total spend per subscriber – Uber One members order nearly three times as often as non-members, meaning their overall contribution to revenue far exceeds that of occasional users.
- Smart pricing and upselling – Uber leverages dynamic pricing, order surcharges, and promotions on high-margin items to extract additional value from frequent users.
In short, Uber’s model ensures that increased transaction volume isn’t just covering delivery costs — it’s actively driving higher overall revenue per customer.
Subscriptions: It’s a win-win
What makes these subscriptions so effective isn’t just the cost savings — it’s how they remove friction from purchasing decisions. Without a subscription, customers tend to delay purchases or consolidate them into fewer, larger orders. But when free delivery is already covered, every small craving, forgotten item, or impulse purchase turns into an order — driving up both order frequency and total spend.
For retailers, the benefits are just as compelling. Checkers gains better cost efficiencies through optimised delivery logistics, while Uber Eats can leverage member loyalty to drive sustained revenue growth. The key challenge moving forward will be keeping members engaged — ensuring that the value remains high enough to prevent cancellations and combat subscription fatigue.
If the early adoption trends are anything to go by, subscription-based retail is here to stay — and those who refine their strategies now will dominate the market in years to come.
Final Thoughts: The Future of Subscription-Driven Retail in South Africa
- Subscription models aren’t just a passing trend—they’ve reshaped retail abroad and are now gaining traction in South Africa. In markets like the US, they’ve helped retailers build predictable revenue and deeper customer loyalty, adapting to the rise of e-commerce. Now, with South African consumers actively subscribing and spending more, we’re seeing similar momentum locally.
- It’s still early days. E-commerce subscriptions only launched in South Africa in 2023, and while 33% of Checkers’ tracked spend and 44% of Uber’s now come from subscribers, there’s plenty of room for evolution. Amazon Prime started as a simple free delivery service before expanding into a must-have ecosystem of perks. Could Checkers, Takealot, or new players develop a South African equivalent? The opportunity is there.
- Data could be the real game-changer. Unlike occasional shoppers, subscribers generate a steady flow of transactional data, helping retailers fine-tune inventory, pricing, and promotions. Checkers can predict shopping habits and time promotions more effectively, while Uber Eats uses order history to push hyper-personalized offers. The result? Higher spend, better margins, and stronger engagement.
- The race for subscription bundling is heating up. While we haven’t analyzed Takealot More in detail, its approach—combining free deliveries from Takealot, MrD, and PnP Asap!—positions it as a one-stop alternative to standalone subscriptions. Whether this model wins customers or leads to subscription fatigue will depend on the balance between value and pricing.
- Finally, timing is key. In the early days of South African e-commerce, free delivery was a hook to attract customers. Now, as digital shopping becomes the norm, retailers have the opportunity to monetize convenience, shifting expectations once again.
At first, paying for free delivery may have seemed counterintuitive. But the data paints a clear picture: South Africans aren’t just willing to pay — they’re spending more and shopping more frequently because of it. For retailers, this presents a massive opportunity — but one that requires a delicate balancing act. The challenge isn’t just about getting customers to subscribe; it’s about keeping them engaged, ensuring long-term value, and fine-tuning the model for sustained profitability.
With more players entering the space, the role of data and insights will be critical. Subscription success isn’t just about offering free delivery — it’s about creating lasting customer habits. The retailers who understand and refine this model will win customer loyalty and dominate South African retail in the years to come.
One thing is for sure, having a in depth understanding of customer behaviour is pivotal in launching a successful subscription service.
Black Friday 2024 Analysis
Hi there,
Originally started as a post-Thanksgiving clearance sale, American retailers made Black Friday a global phenomenon. And, although somewhat muted in 2024, overall spending still rose by 3.4% year on year in the US – little growth if one factors US CPI at 2.7%. Nonetheless, Black Friday in the USA was still in the black. But did SA retail see a similar return this year? It’s a mixed bag.
Going into Black Friday in SA, retailers would have been keenly aware of local buyers' crunch and perhaps expected a more conservative buying approach. But to what extent have economic conditions impacted Black Friday in 2024?
To measure the impact of Black Friday on SA retailers, we analysed the 80 days of spending leading up to Black Friday at 28 retailers and compared this to the spending during Black Friday weekend (from Black Friday to Cyber Monday).
A major factor we looked at is just how much the daily spending increased over the Black Friday weekend compared to the 80 days leading to Black Friday – we call this the Black Friday Multiple (BFM).
Let’s dive in.
Emptying wallets before Black Friday?
The average spending across the 28 retailers leading up to Black Friday 2024, increased by 2% from the year before—slightly below the inflation numbers for November ‘24, which came in at 2.9%.
Some retailers made this period count, either through month-long promotions or simply better year-on-year (YoY) performance.
Growth in Spend: 8 Weeks Leading Up to Black Friday

It’s worth noting that both Amazon and Temu were excluded from this graph. These two have seen massive increases in spending, capturing 4% and 5%, respectively, compared to Takealot’s 27% of the 28 retailers analysed.
This is significant for Temu, considering they have only been around in South Africa for a little more than a year.
Percentage of Tracked Spending

How did Black Friday Impact Daily Spend
During the 2023 Black Friday period, the average increase (BFM) in daily spending across all retailers tracked was 179%. But in 2024, it had less of an impact, with Black Friday increasing daily spending by only 134%.
The reduced impact can also be seen by comparing sales and transaction values of 2023 with 2024:
- An 8% decrease in the number of transactions
- A 15% decrease in total spend
- A 1% decrease in average transaction values
Major winners in 2024 include Game Online (384%), OneDayOnly (385%) and CottonOn Online (419%). Takealot saw a somewhat less impactful Black Friday, with a daily spending increase of 166% in 2024 compared with a 254% increase in 2023.
Black Friday Multiple: 2024 VS 2023: Per Merchant

An interesting observation is that while Temu saw a great increase in YoY spending in the period leading up to Black Friday, it’s Black Friday numbers almost look the same as regular daily spending, with only a 37% increase over the Black Friday weekend.
One could argue that with the constant discounts and vouchers offered on Temu, customers might have become “immune” to additional offers such as Black Friday. Discounts become part of the expectation, and it makes seasonal promotions hard to identify.
The low Black Friday impact for Temu could also be due to customers reserving Black Friday purchases to buy bigger ticket items (TV, Fridge, etc). Massmart Online, Game Online and Makro Online average transaction values of R3’380.22, R3’075,23 and R3’403.98, respectively, seem to motivate this behaviour.
The big shift online
Compared head-to-head, online showed a remarkable ability to generate the “Black Friday Effect”, far outpacing in-store in its ability to increase daily spending from the pre- to Black Friday itself.
Daily Spend: Offline VS Online

Online also saw its share of spending increase from 60% to 63%, highlighting how marketing during the Black Friday period could bear much fruit for retailers with the right strategy.
Share of Spend: Offline VS Online

Nothing eats margin in e-commerce like delivery fees, and higher transaction amounts are often indicators of higher margins. Massmart and iStore (not surprising considering the costs of Apple products) lead the charge here. Temu, which offers free shipping on all orders, has an average transaction value 3 times lower than the online average.
Average Transaction Value: Online

Black Friday Conclusions
Retail is definitely feeling the pain of a cash-strapped consumer when not even the most enticing discounts of the year could fuel growth. There are, however very positive signs for e-commerce, particularly around its ability to clear stock at discounted prices.
It’s also clear that even in the midst of cash-stripped consumers, Black Friday can, for most retailers, push daily spending up by more than 100%.
Black Friday in SA was down this year by 12%, unlike the US, which saw some minor increases in sales. This further emphasises the strain SA retail has been under in 2024.
All things considered, it’s likely a black Friday most local retailers would like to forget.
Let’s hope the festive season brings some good news for local retail.
Spending Surge
In Summary:
- Strong retail performance: September’s sector-wide rise in consumer spending signals a positive shift in consumer confidence.
- Macroeconomic boosters: Recent finance announcements strengthen financial security and spending power - potentially amplifying past Q3 spending trends.
- Grocery: Consumer wellbeing continues to drive decisions with Vitality’s partner switch positioning Checkers as stronger than ever.
- Apparel: “More pocket, same mindset”, with value-for-money brands emerging as clear winners in the clothing sector.
September Sector-wide Wins
September 2024 has been a strong month for South African retail, with most sectors experiencing YoY spending growth. When compared to past year’s results however, we see a steep increase in August to September spending.
We dive into the macro factors influencing consumer spending below.
Growth in Spend per Category

SA Optimism on the Rise
News of the South African Reserve Bank initiating its monetary easing cycle with a 25 basis point cut in September has eased the debt burden on consumers and increased their disposable income. This, paired with a three-year low in inflation and September marking the fourth month of consecutive fuel price cuts - has added to the general air of economic optimism in the country.
Other factors, including the strengthening of the Rand against international currencies, has reduced import costs - with the potential to decrease retail prices. Although the effects of this haven’t been seen in the apparel sector yet, the stronger rand has already boosted pharmaceuticals and tech hardware imports.
The new two-pot system however, may have the largest immediate impact on consumer spending. The government has reported that withdrawals have already reached R21 billion, with analysts highlighting that 24% of this has been spent on home and vehicle expenses and a further 11% designated toward day-to-day expenses.
In fact, the Reserve Bank estimates the two-pot system could add 0.1% and 0.3% to GDP growth for the country in 2024 and 2025. A massive boost to SA consumers' pockets, with the potential for an additional R2.3 billion per month in the near future.
Overall, positive economic indicators are boosting consumer confidence and our data suggests these factors have likely boosted retail spending.
Historical Q3 Retail Trends Compared
3-Month Growth in Spend: All Retail Categories

Beyond the above positive macroeconomic factors amplifying historical spend drivers like back-to-school purchases and early holiday preparations, there are some new and interesting dynamics affecting purchase behaviour across individual sectors…
Sector Deep Dive: Uneven Growth & Shifting Dynamics
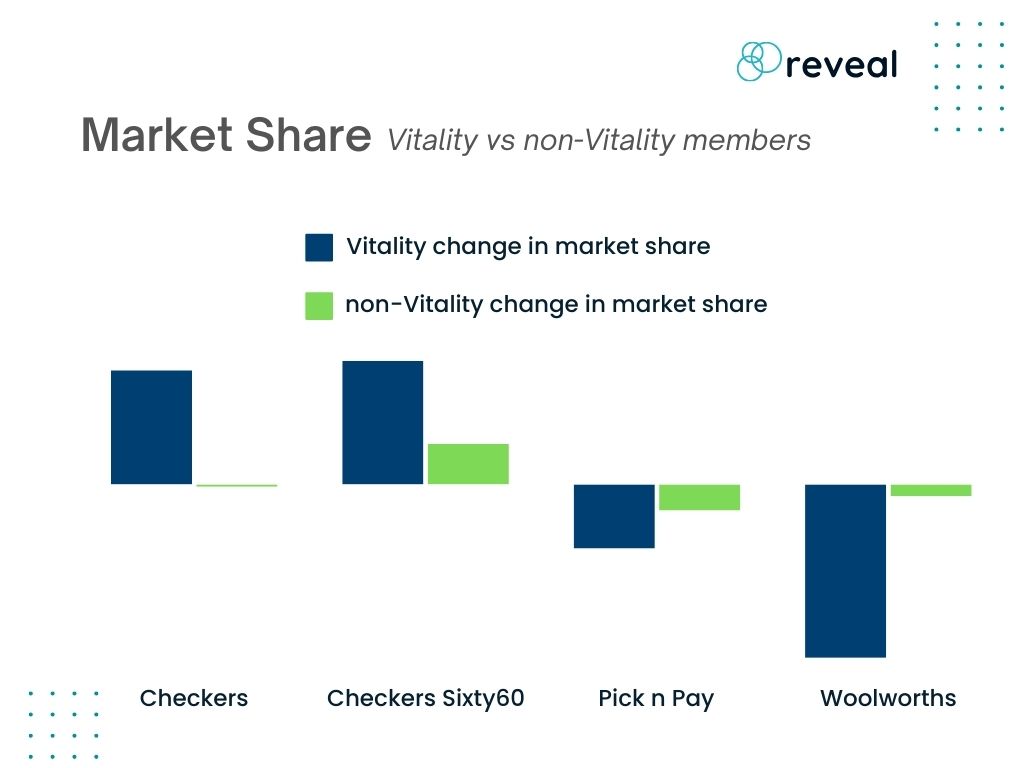
In terms of overall Grocery performance, Checkers (17%) and Woolworths (6%) both reported strong individual YoY growth in September, outpacing the larger retail sector (3% growth). Checkers’ growing presence has been further strengthened with its takeover of vacated Pick n Pay locations, only reinforcing its market position.
Despite Pick n Pay showing a minor recovery (-13% YoY in August to -12% YoY in September), the retailer continues its downward trend, potentially marred by store closures and shrinking market share. Despite this, we are not naive to think things can’t change in the moment - time will tell if Pick n Pay is merely lying low or preparing for its moment of opportunity.
Consumer Vitality Shifts Gears
In recent years, a growing trend towards healthy living has reshaped consumer behaviour, and it's no surprise that Checkers has been quick to capitalise on the movement. As people have become more health-conscious, the demand for premium, healthy groceries has risen, pushing brands to cater to this market shift.
Checkers, following Woolworths, have stepped up to meet this demand. Discovery Vitality is pivoting to consumer preferences (and potentially Shoprite Holding’s strong growth outlook) by opening its doors to its newest Vitality points partner.
Discovery’s new partnership with Checkers from 1 September however, means that Pick n Pay is out. A decade-long relationship has seemingly ended, highlighting a shift towards top-of-mind brands whose performance secures consumer loyalty. This decision, along with Woolworths retaining its Vitality Healthy Food partnership, signals that the brands have become the go-to for health-focused shoppers.
The below graph shows the August to September MoM market share change for Vitality vs Non-Vitality Members:
Who packs the grocery punch?
When we break down Groceries’ market share by number of customers, overall spending, and the number of purchases customers make, it becomes clear that Checkers has an edge. Even though Pick n Pay shoppers tended to spend more per shop, Checkers made up for it by having more customers and a higher number of transactions.

In terms of in-store vs online spending, data shows that online shoppers seem to prefer buying online rather than buying in-store.
Consumer spending for Woolworths also reveals some interesting insights: despite the retailer only holding a small slice of the groceries market “pie”, Woolworths online shoppers had the largest basket size - suggesting that a strategy to direct its customers online would be to the retailer’s advantage.
Not to forget Checkers’ Sixty60, the app has captured a sizable portion of the market, accounting for more than half of Checkers' in-store sales. It also has the highest number of transactions per customer, with shoppers spending just a bit more per online order when compared to those visiting physical stores.
Apparel Sector Spending
Closing off with Apparel, we’re seeing notable shifts. The sector is making a slow comeback. Traditional Clothing’s market share has grown from 82.8% in August to 83.2% while the Footwear category, although the smallest, has increased its share from 5.4% to 5.8%. The Sports and Outdoor category, however, has taken a hit, dropping from 11.8% to 11% despite the warmer weather.
These sector shifts suggest that consumers are reassessing their spending priorities, focusing more on the essentials rather than speciality items like sports gear.
This could indicate that South African shoppers may still be cautious despite the government’s latest announcements.
Merchant breakdown: Checkers goes for Checkmate
The merchant with the strongest September growth has been the most surprising. Pep has emerged with 20% YoY growth, suggesting that value-focused retailers are benefiting from price-conscious customers. It remains to be seen if the introduction of the two-pot retirement system could further drive spending at retailers like Pep, as consumers seek value-for-money items that can stretch their money further.

Not to be stopped, however, Checkers has dived into the Apparel sector. UNIQ has reported impressive YoY growth (73%), despite being a newer retail player. The brand’s growth potential is significant – with transactions increasing and an opportunity to grow basket-size value.
Despite earlier losses, Pick n Pay is holding its ground in Apparel, showing stronger growth than competitors like Ackermans and CottonOn. It’s unlikely that news of Checkers’ wins is driving store traffic, Pick n Pay’s retail department is doing something well amidst its broader challenges in the market.
Looking Ahead: Black Friday and Beyond
With Black Friday on the horizon, retailers are gearing up for one of the year's most significant shopping events. The current positive economic sentiment sets a promising stage, but competition is fiercer than ever.
You can find our 2023 report on last year’s Black Friday retail results by clicking the link. Should you wish to add a competitive edge to your 2024 Black Friday strategy, contact us to pre-purchase our October report and insights round-up now.
Omnichannel Retail Insights
In Brief
- August data indicates that spending for most retail sectors is on the decline, highlighting potential shifts in consumer behaviour.
- Despite the growth in online shopping, in-store sales continue to play a significant role in retail performance.
- Data suggests that retailers with strong in-store and online channels may be outperforming those focusing on a single channel.
- We explore how an omnichannel approach could drive the competitive advantage needed to dominate online-only entrants.
August brought notable shifts in consumer spending across retail categories. Our latest data reveals declines in most sectors, with intriguing exceptions that warrant a closer look.
Growth in Spend per Category

Virtually all retail categories (eating out, general merchandise, groceries, media and pharmacy) experienced a drop in sales growth YoY from August 2023 to August 2024. Apparel is the notable exception: Despite being the worst-performing in total growth year-over-year, it was the only category to maintain stable spending over the period.
Media spending saw a significant drop, from the highest growth in 2023 to the second lowest in 2024. The steep drop could indicate a shift in South Africa’s media consumption, potentially reflecting dramatic declines in media subscriptions like DStv, and increased adoption of free social media platforms.
Inflation and economic pressure could also be causing consumers to cut back on discretionary spending in categories like eating out and media. It’s certainly why consumers and retailers alike will be delighted by the Reserve Bank’s September 2024 interest rate cut of 25 basis points and also tracks with the trend of living essentials such as groceries seeing the most growth in spending.
The challenge for retailers will be to adapt to these changes in consumer behaviour while seeking growth. And this could be where the omnichannel approach becomes vital…
The Omnichannel Advantage
Omnichannel retailing refers to providing a seamless shopping experience across both online and offline channels. It endeavours to meet consumers where they are, which in the pandemic and immediate aftermath was definitely online and at home.
However, four years on, and with numerous online-only players entering the scene, there’s reason to believe that the physical store is not dead. It could even be a vital element in making e-commerce truly viable.
Data shows that retailers like Checkers, Bash and increasingly Woolworths, which all have strong online and in-store offerings, outperform competitors.
When comparing grocery in-store versus online growth in market share over the past year, delivery outpaced in-store. But zero in on just the last 3 months and you’ll see that in-store gained almost 3X market share compared to delivery in the short term.
Market Share: Grocery In-Store VS Online

While Delivery has certainly seen the most growth over 12 months, look at In-Store (in green); it saw the most growth over the most recent 3 months – the physical store remains a strong and vital part of retail.
And let’s not forget that in-store still accounts for the lion's share of the overall market in South Africa – 67% versus online’s 11% – meaning that if you’re strong in-store, you likely have the continued income and ability to invest in developing your e-commerce business.

Plays in Grocery Retail
Looking at traditional retail, with Checkers and Woolworths' market share on a slow, long-term downward dip, it's Pick n Pay that’s falling behind. The group's multiple recent store closures could highlight the impact of sacrificing brick-and-mortar channels.
That said, Pick n Pay Group seems to be making a strategic shift – listing its Boxer stores separately from PnP on the JSE later this year. We’ve shown in the past that Boxer managed to claim a 9% share of spending among lower income brackets – the vast majority in SA.
Woolworths, on the other hand, is experiencing such growth online, it’s augmenting its solid online and physical presence by opening dark stores, aimed at serving online sales without disrupting stock levels and the experience for shoppers in-store.
Checkers had also opened a dark store back in 2022 for similar reasons.
The Picture in Food Delivery
The trend of physical boosting online becomes even more pronounced when you look at the on-demand and food delivery segments. Those with both online and physical presences – Checkers Sixty60, PnP asap! and Woolworths Dash – outperform virtual-only services like Mr D and Uber Eats.
Market Share: On-Demand & Food Delivery

Indeed, our data shows that Uber Eats’s Average Transaction Value variable remains relatively consistent if not climbing, meaning that a market share decline is likely due to losing customers.
Big Omnichannel Wins in Apparel
When it comes to truly maximising the potential of omnichannel, few brands can compete with the customer experience of TFG’s Bash. The level of online-instore integration is phenomenal – while shopping for jewellery, clothing or accessories in any of the 3’000 stores, if an item you like is out of stock or not in your size, you simply jump on the app and get it sourced processed and delivered for you by the time you get home, and vice versa.
Earlier this year, Bash became SA’s top fashion and lifestyle app, reportedly leading to a 45% increase in first-time shoppers and a 22% increase in online retail turnover.
The approach of using online to augment in-store enabled Bash to hold market share against newcomer Temu, who came in to capture around 20%. In fact, Bash seems to have marginally gained market share, while Shein’s dropped significantly – indicating Temu and Bash both gained on it.
In fact, SA online-only Superbalist declined by almost 10% YoY.
Apparel Market Share: 3 Month, Per Income Group

After seeing its online apparel market share decline from 27.69% in August 2023 to 18.13% in August 2024, Takealot has decided to sell Superbalist to a PE consortium.
In a year where they lost market share to Temu, Shein and Bash, Superbalist has also seen their average transaction size decrease from R1’042 to R1’016 (that's excluding the impact of inflation) while also seeing a dip in transactions per user.
At the same time, Shein’s response to Temu’s arrival was to set up a physical pop store in Mall of Africa in August. This should send a clear message to SA retailers that their best defense against competitive newcomers is their physical store presence.
Additional Insights for Competitive Omnichannel
- Customers today require more than just transactions. Online channels need to augment and amplify in-store and vice versa, which requires a carefully considered, advanced and truly cohesive approach centred around the customer’s experience – see Samsung’s guide to using mobile empower retail.
- A big part of this is for retailers to start distinguishing between the Point of Sale (designated checkout position) and the Point of Purchase (POP), where exactly the customer is when they decide to make a purchasing decision. To see how this might affect your omnichannel decisions, consider this helpful guide to POP.
These intertwining narratives and others reshape South Africa's retail landscape. Understanding and adapting to these changes will be crucial for success in the coming months.
As always, we're here to provide competitive data insights and analysis to help you navigate South Africa's dynamic retail landscape
If you have any questions or are interested in purchasing access to our Market Performance Dashboards don't hesitate to reach out.
Here's to your prosperous Q3!

Battle of the pharmacy giants
Welcome to the free version of our newsletter that analyses themes emerging from our live Market Reports. The client version of this Shop Talk includes:
- Access to the Market Reports.
- Analysis of general spending trends across the major retail categories during June 2024.
- Real-time spending data for Clicks’ and Dis-Chem’s online channels, showing potential for growth.
As a taste of what to expect, here’s a look at how spending trends at South Africa’s two biggest pharmacy chains.
The retail pharmacy market is more concentrated than any other category we track. Just two companies – Clicks and Dis-Chem – account for the majority of 22seven user spending in this category. It’s also worth remembering that Pharmacy is different to other spending categories because the customer is not always the one paying. Medical aids and insurers often fund a customer’s medicine purchases from a pharmacy. The retailer reports this transaction as a sale but the transaction doesn’t appear on a user’s bank statement.
Disclaimer done, it’s still interesting to segment the category into Clicks, Dis-Chem and ‘Independent Pharmacies’. The ‘Independent’ grouping includes chains like Pharmacy @ Spar, Shoprite’s Medirite, Dis-Chem-tied The Local Choice, Alphapharm and a sizable number of smaller pharmacies.
Interestingly, growth in the Independent sub-category didn’t follow the same upward trend as the rest of the category in June. This could be due to the widening gap in the sector between the two dominant chains and the rest. Dis-Chem and Clicks generally stock a wider range of non-dispensary products, and that selection is growing. Note, too, that Dis-Chem and Independent Pharmacies experienced more pronounced fluctuations in spending growth, with significant spikes and declines. In contrast, Clicks has shown a more stable trend with less variation.
SPENDING GROWTH: RETAIL PHARMACY

Battle of the giants
Cash-flush Clicks, which has earmarked nearly R1bn in capital investment for the 2024 financial year, plans to open as many as 55 new outlets, increasing its store base to more than 1,200 in the long term. The group has also invested in a dedicated e-commerce warehouse that can deliver more than 1m parcels per annum to consumers.
This dovetails with the new Clicks app: shoppers can access most products they would find in-store, track their orders and check their ClubCard points. Other features include the ability to submit scripts, make clinic bookings or chat to a pharmacist. With a 4.6 star rating on the Apple App Store, it seems that consumers are enjoying the user experience.
Dis-Chem has also been busy. With a new CEO and an equally ambitious expansion plan, the group aims to open about 140 stores in the next three years. (Clicks currently still has a significantly larger footprint with ~900 stores nationally, compared to Dis-Chem’s ~270.)
Against that backdrop, let’s look at user spending across the two chains. Our 22seven data favours Dis-Chem, whose market share is 56% compared to 44% for Clicks across the demographic spectrum. Probably due to its bigger store footprint, Clicks has a higher number of customers transacting monthly, but these customers transact less frequently than Dis-Chem customers, and they spend less each time. Dis-chem’s smaller overall number of users spend significantly more per transaction, which accounts for the group’s greater market share.
Note that the 22seven user base is skewed towards middle- and higher-income earners, and Dis-Chem’s market share increases as income increases. (For users earning R60k+ pm, Dis-Chem’s market is ~60%; in the R15–25k pm demographic, market share is closer to 50%.) The same pattern is observed when we segment for age: older users tend to prefer Dis-Chem, whereas Clicks appeals to a younger user base.
The chart below takes an average across the demographic spectrum and compares the two retailers on user base size, total monthly spend, market share and average transaction value. Importantly, even though the average transaction value at both retailers increases slightly every month, there’s no evidence yet to prove the success of either retailer’s expansion strategy.

Online is where it’s at
Over the last few months, we’ve done extensive reporting on how online-only retailers like Shein and Temu have disrupted the local market, and how local businesses like Checkers Sixty60 have attempted to level the playing fields. The Covid-19 pandemic fast-tracked online growth. While most local retailers have some sort of online strategy, some have been far more successful than others.
In the pharmacy space, Clicks seems to be taking the lead in this regard. Although online shopping at both Clicks and Dis-Chem is still a very small component of total spend among our users, the trend is almost the opposite of what we see in-store: Clicks is ahead of Dis-Chem on almost every metric, by a long way…
The full report is available to clients. Contact us to learn how you can access research via your broker or subscribe directly. To see more of what we do, click the links below.

Convenience wars
In brief
- In May, international giant Amazon quietly stepped into South Africa's e-commerce space. Despite its launch drawing initial skepticism, early data indicates a promising start – and a sizeable increase in market share in the General Merchandise category.
- Checkers Sixty60 continues to drive innovation with it’s BETA app, adding Checkers Hyper products to its 60-minute delivery service. Increased sales within select Cape Town suburbs reveal the potential value of Q-commerce (quick commerce) to a greater market segment.
If you’ve read our recent reports, you’ll be familiar with the extensive impact that Chinese e-commerce sites, Shein and Temu, have had on South Africa’s online retail landscape. And let's not forget about the launch of Amazon South Africa...
Even though there are ongoing legal battles to regulate import taxes and protect local suppliers, local retailers have still been forced to shift their approaches to reassert dominance and differentiate themselves from their international rivals.
Let’s take a look at what’s been happening…
The sleeping giant wakes
Amazon South Africa officially launched on 6 May 2024, but the response was underwhelming. Some sources in the media criticised the brand for forgoing its unique products, including the beloved Kindle e-reader, Fire TV, Ring video doorbell and Amazon’s famous Alexa. In addition, buyers were faced with 'out of stock' notifications during checkout.
Despite this, among the South African users we track, there were more purchases at the local Amazon in May than on Amazon international for the the whole year.
Amazon’s combined May figures not only record the highest number of users across the entire 2024 period, but reveal that the brand’s market share in the General Merchandise category has doubled.
USER NUMBERS: AMAZON.COM vs AMAZON.CO.ZA

Interestingly, despite Amazon South African having a greater number of users, Amazon international users transacted more frequently. Average basket value on the local site matched competitors like Takealot and Makro.
Reveal’s data suggests that local retailers should remain vigilant in upcoming months. The next few months will tell if Amazon South Africa's 'quiet' launch was in fact the formidable foe just biding its time...
Checkers Sixty60: Hyper-fast in Cape Town
Checkers has always been at the forefront of all things e-commerce in South Africa, and this latest development is no exception: They're challenging Takealot’s new offerings in the General Merchandise space with an all-new app of their own. Users in select Cape Town suburbs can now order general merchandise from Checkers Hyper and get it delivered within 60 minutes via the Checkers Sixty60 app.
We analysed all users who regularly shop on Sixty60, and we identified the customers transacting in the suburbs where the new Beta app is available – to account for other outside variables and measure the potential effect of selling Hyper products on the Sixty60 app.
The number of customers using the Sixty60 app in these suburbs increased in May, despite a noticable decline in the overall Sixty60 user base since March.
PERCENTAGE CHANGE: NUMBER OF SIXTY60 USERS

When it comes to average transaction value and number of transactions per user, both metrics showed minor changes from April to May. For the target users on the Beta app, both metrics increased; for the users of the regular app, average transaction value decreased slightly while average number of transactions increased slightly.
The total spend for users in suburbs where the new app was rolled out reached its highest value for the year in May. Although the total spend for the entire base also increased in May, growth on the regular app was less than half of that observed for the Beta app.
In summary, the early data suggests that customers using the beta version of Sixty60, with access to a far wider range of products, are likely to shop more frequently and spend slightly more each time, compared to the customers using the original app.
Time will reveal a more complete picture in the months ahead. Watch this space...
PERCENTAGE CHANGE IN TOTAL SPEND: SIXTY60 USERS

Takealot jumps on the subscription bandwagon
In Mission Possible, we analysed the effectiveness of Checkers' new Sixty60 subscription service. Now Takealot has thrown its hat into the ring with TakealotMORE – a similar subscription service where users can access unlimited free deliveries from Takealot and parter delivery services like Mr D and Pick n Pay asap!
On 13 May, TakealotMORE launched with a free 7-day trial, followed by unlimited free next-day deliveries for just R39 a month or R99 for a premium subscription with no minimum spend.
We segmented users who subscribed to TakealotMORE in May and compared their spending at Takealot, Mr D and Pick n Pay asap! before and after signing up for the subscription service.
The results are fascinating...
The full report is available to clients. Contact us to learn how you can access research via your broker or subscribe directly.

Mission possible
In brief
- Xtra Savings Plus is a subscription service offered by Checkers, which gives shoppers unlimited Sixty60 deliveries and a one-off 10% discount on an in-store purchase per month. The introductory price is R99pm, discounted from R149pm.
- Our data shows that XSP has been successful so far, at least from a customer perspective. Retention is high and the service is popular among older, high-income shoppers.
- We analysed a cohort of XSP subscribers to see how their grocery spending in March and April 2024 compares to grocery spending during the same period in 2023. Average spend at Checkers among this cohort increased by 28% to R5,617pm, and the average number of Sixty60 orders increased by 44%.
- When it comes to profitability, however, the numbers for XSP are less convincing. We estimate gross profit may increase by 9% if XSP subscribers do not take up the in-store discount. If they do, gross profit may decline by 5%. Ultimately, we think that XSP is a ‘prime’ example of local retailers adapting to growing international competition.
Towards the end of last year, Checkers launched their Xtra Savings Plus subscription service. You probably remember the ad: a faux Tom Cruise in all his greatest moments (although sadly not as Stacee Jaxx), spending and swiping and saving the world.
For an introductory offer of R99pm, discounted from R149pm, subscribers could access unlimited Sixty60 deliveries, plus an additional 10% saving on one in-store purchase per month.
‘Xtra Savings Plus’ is quite long and complicated, so we’ve abbreviated it to XSP. In this research note, we’re going to evaluate the profitability of XSP as a subscription service. Using a new retention model, we’ll see how it stacks up against other leading consumer subscription services like Netflix and Spotify. Drawing on our unique real-time spending data, we’ll also highlight which shoppers are using XSP, and how XSP has affected their purchasing behaviour.
In the end, we’ll hopefully have enough inputs to answer the question that all analysts and competitors should be asking: Is the Xtra Savings Plus subscription model profitable for Checkers?
Customer retention
In case you’re wondering why we’re comparing XSP to Netflix and Spotify (and Showmax, for local flavour), it has to do with the word ‘subscription’. The subscription business model has become synonymous with media streaming services, even as it has spread to other services. Comparing on this basis is not perfect, but it does provide a benchmark to evaluate how successful XSP has been so far.
To be clear, XSP is not yet in the same league as Netflix and Spotify. The number of South Africans subscribing to the major global media services is orders of magnitude larger. Netflix is the big daddy, with c7.6 subscribers for every one XSP subscriber in the sample.
But what about Sixty60 users and Checkers in-store shoppers? Including these metrics gives more context to the research and helps to scale the samples.
So, here’s what we’re looking at: There are about the same number of Spotify subscribers in the sample as there are Sixty60 shoppers, and 1.5 (standalone) Showmax subscribers for every XSP subscriber. The number of Checkers in-store shoppers is many times larger than any subscription service.
RELATIVE SIZE: NUMBER OF SUBSCRIBERS/SHOPPERS TO EVERY XSP SUBSCRIBER

We’re specifically interested in how these services retain their customers, month to month. By our definition, retention means the proportion of last month’s customers who subscribed again this month.
From the chart on the next page, it’s clear that customers are loathe to give up their Netflix and Spotify subscriptions. Nearly 95 out of every 100 customers prioritise paying their subscriptions to these services each month. (No wonder credit bureaus around the world are searching for alternative measures, like subscription payment profiles, to offer differentiated credit scores and increase access to credit.)
XSP’s retention level is just below this high-water mark. Currently, nine out of ten XSP subscribers maintain their subscription on a month-to-month basis. Showmax’s retention, by comparison, is a little lower at ~83%.
In general, we note that retention seems to fluctuate fairly predictably. The rate weakens in the early part of the year, maybe as a result of consumers struggling to maintain their festive season splurging.
CUSTOMER RETENTION RATE: JAN 2022 – APRIL 2024

Who subscribes to Xtra Savings Plus?
In previous reports, we have shown that on-demand grocery delivery is most popular among mid- to high-income, predominately middle-aged users – the time-starved working families or professionals who can afford not to go to the supermarket.
Our most recent spending data shows that XSP exaggerates this trend and appeals to the Sixty60 super fans. In other words, a Sixty60 shopper is likely to be relatively wealthy and they’re likely to fall into the 35–45 age bracket. XSP subscribers are even more likely to earn in a higher bracket and more likely to fall into the 35–45 age bracket.
SIXTY60 USERS AND XSP SUBSCRIBERS, BY INCOME AND AGE

Convenience, delivered
Now that we know who subscribes to XSP, let’s see how unlimited delivery has affected their purchasing behaviour and whether a subscription model can be a profitable business for Checkers.
The best way to measure the effect of XSP of consumer behaviour is to take today’s XSP subscribers, review their current grocery spend, then look back in time and compare how they were spending this time last year.
Fortunately, that’s exactly what Reveal can do.
From the sample of XSP subscribers, we identified a sub-sample of 1,770 XSP subscribers with uninterrupted transaction data that allows us to compare March and April spending between 2023 and 2024.
We looked at all spending at the four major grocery retailers over this period. The average total grocery spend by today’s XSP subscribers has increased by 10% to R11,250 pm.
These shoppers were already regular Checkers shoppers. Since subscribing to XSP, their spending at the retailer has increased even more. In 2024, among this user sample, Checkers accounted for 50% of the average total monthly spend on groceries – an increase of 7 percentage points (pp) over 2023. Average spend at Checkers by XSP subscribers increased by 28% to R5,617pm and the number of Sixty60 orders increase 44%.
Interestingly, however, the average Sixty60 order value among this cohort declined 10% to R432 (more on that later). In-store visits and average maximum in-store purchase values also decreased.

Can Xtra Savings Plus be profitable?
Checkers’ spending share gains have been won in equal amounts from all of the other major grocery retailers. In this particular consumer segment, Woolworths has the second largest share (-2pp on 2023 share), followed by Pick n Pay (-3pp) and Spar (-2pp).
Of the R11,250 that these XSP subscribers spend on groceries each month, they spend R5,617 (50%) at Checkers. Sixty60 accounts for 37% of that spend – an increase of 10pp over 2023.
From this data, it’s clear that Sixty60 accounts for all the increases in total spending at Checkers for this cohort. (In-store sales actually declined, as did in-store shopping trips.) With the licence to summon unlimited baskets to their door, the average number of Sixty60 orders has increased by 44% – from 7 orders to 10 orders per customer per month – even as the average order value has decreased by R46 (10%) to R432. (Much of that decline can be explained by no longer having to pay the R35 delivery fee…)
Finally, the maximum average transaction value (ATV) per customer is ~R1,260. Maximum ATV is relevant because we think it’s reasonable to expect that XSP subscribers use their monthly 10% in-store discount for their highest-value purchase.
From the customer’s perspective, an XSP subscription appears to be a significant benefit. Instead of spending R243 on delivery fees (7 * R35), they spend just R99 and order more often. Total spending at grocers has increased by 10%, roughly in line with inflation over the period, so the monthly saving of R144 equates to c1.3% of monthly grocery spend.
Checkers has clearly won share of spend that will support revenue growth, but what do these findings imply for profitability?
The table on the following page estimates the profit impact of XSP from Checkers’ perspective.

In 2023, the cohort under review were spending an average of R4,402pm at Checkers. During the same period in 2024, they spent R5,617 – an increase of 28%. After VAT, delivery and subscription fees, these customers are spending a total of 33% more on groceries in 2024.
The main assumption is what the average gross profit margin might be for a Sixty60 order. If the Shoprite Group gross margin was 24.1% in FY23, we’d assume the contribution from a Sixty60 order should be higher – more branded items and more fresh produce in the basket. With that in mind, we’re assuming a 25% gross margin on a Sixty60 order.
At that margin, Checkers’ average gross profit per customer in 2024 is 33% (or R295) higher than in 2023 (assuming Checkers foots the bill for the same cost per delivery – R30.50 after VAT – net of the subscription received). If we were to stop there, Checkers’ estimated gross profit per customer would be up 9%, or R77.
But XSP subscribers also get the benefit of an extra 10% off an in-store purchase. Not all subscribers will redeem this benefit, however. The average XSP subscriber is shopping less in-store and there are additional actions that he or she must undertake to redeem the discount. (Such actions typically cause conversion rates to fall.) The worst case for Checkers is if every subscriber redeems the discount on their highest-value purchase each month (~R1,261). If that were the case, then our estimate implies gross profit per XSP subscriber declines by 5%. By the same logic, Checkers will break even if less than 61% of XSP subscribers do not redeem their in-store discount.
What does the future hold?
Our data suggests that XSP has been a hit for customers: Retention is high and stable, and the service offers meaningful customer value.
But the evidence of profitability for Shoprite shareholders is potentially less definitive. XSP is almost certainly driving stronger market share and revenue gains among higher-earning customers. This is a known strategic objective for the company and it might translate into gross profit growth between -5% and +9%. Inevitably, investors will complain that XSP is diluting margins while management will argue that they’re banking rands not percents.
There are other factors to consider:
- Sixty60’s effect on trading profit is still uncertain. For example, ‘dark stores’ or mini distribution centres are popping up – these service Sixty60 orders only. There’s one such ‘dark store’ close to Reveal’s offices in Cape Town. It’s like a beehive, with bikes coming and going at high frequency. The seemingly higher trading density and obviously lower occupancy cost might well translate into better trading margins than the average Checkers store.
- Strategically, an XSP subscriber is now even more immersed in the Checkers/Shoprite ecosystem. They’re tied to the points balance on their Xtra Savings card and they’re hooked on the convenience of Sixty60 delivery. We argued in Grocery Games that Sixty60 would inevitably expand into a larger general merchandise offering – something that is now happening. As Amazon launches in South Africa, perhaps an XSP subscription is the best defence against this giant retailer hitting its ‘prime’ on our shores…

Ready to unlock new insights?
One of the team will get in touch soon!
