

Temu takes off
In brief
- Temu is a global online megastore operated by the Chinese e-commerce company PDD Holdings. You can get nearly anything and everything, from a hiking tent to bike parts to an outfit for your dog. Items are shipped directly from China.
- This is a review of the shoppers who purchased from Temu during March 2024. The idea is to describe who these customers are, and where they’re not shopping now that they’re shopping at Temu. Since we only have one month of data, it must be stressed that these are initial insights.
- From a standing start in January 2024, our analysis shows that spending at Temu has accelerated exponentially. In March, more users shopped at Temu than at Shein, the Chinese apparel merchant.
- The data shows that these ‘early adopters’ are older and higher-earning than typical online shoppers in South Africa
- Who is losing out to Temu’s wins? Takealot’s spending share has decreased significantly and Superbalist’s share is half of what it was a year ago.
It has been a tumultuous few years for South African retailers. Brands in almost all sectors are under attack from Chinese sites that advertise aggressively on social media, undercut on pricing and ship directly. We have already shown how Shein, the Chinese fashion site, has claimed a significant share of the local apparel market.
Now we have Temu – a more general marketplace site in the mould of Amazon or Takealot. Temu is inescapable. Of late, you can hardly scroll through Facebook or Instagram without being bombarded by adverts. In the US, they bought a prime-time slot during the Superbowl, which led to the Temu app rising to second most downloaded on Apple devices.
In the most recent edition of Shop Talk, we highlighted the explosive growth of Temu in South Africa. During March 2024, more users bought from Temu than they did from Shein.
The purpose of this note is to understand more about the Temu shopper in this country. Who are they? And which online competitors are these shoppers shunning when they elect to buy from China?
A caveat before we get going: This is only one month of data. Although our sample is healthy (>2,000 users), the short time frame limits the extent of the analysis.
Still, it’s abundantly clear that Temu, and other sites like it, are here is here to stay. Consumers are not put off by the logistical challenges of using such sites, and their numbers are growing.
The big spike in March
The chart below shows the speed at which Temu customer numbers in South Africa have grown. During March, more users bought from Temu than from Shein.
At the time of writing, there was no spending threshold for free delivery at Temu, which is unusual for online retailers. Most local companies, including Takealot, have a threshold of around R500. Shein’s is a bit higher at R600. Normally, the threshold informs the average transaction value on a particular site as customers try to qualify for free delivery.
Temu’s average transaction value is around R500, which is high considering that customers need not spend that much for free delivery.
TEMU: CUSTOMER GROWTH AND AVERAGE TRANSACTION VALUE

Who are Temu’s customers?
In order to analyse spending at Temu, we first looked at all the users in our sample who shopped online, at a long list of online retailers including Takealot, Makro, Shein, Bash, Dis-Chem, Temu (obviously) and many others. Then we compared the Temu shopper and the average online shopper to all users with purchases in the Home and Apparel categories. We segmented the analysis by income bracket and age. Since Shein operates in a similar mode to Temu, we included it as a barometer.
In general, our data shows that wealthier customers tend to shop online more frequently than customers with lower incomes. This seems logical. When it comes to Temu, the ‘early adopters’ are even more likely to be on the wealthier end of the income spectrum. Since Temu is new in South Africa, users might be experimenting with a few inexpensive purchases. As higher earners, they’re prepared to take the risk of not receiving the product and/or receiving something of an inferior standard.
Interestingly, Shein shoppers are more likely be middle-income users. In that sense, the Shein shopper demographic more closely resembles that of the ‘average’ online shopper.
When it comes to age, the average online shopper closely matches the demographic of the average general consumer. In other words, online shoppers are less likely to be very old or very young – they’re mostly in the same demographic as the people who use brick-and-mortar stores.
The early Temu shoppers are different, however, with a marked trend towards the older side of the spectrum. This differs from the average Shein shopper, too, who is more likely to be in the 26–35 age category.
In summary: Online shoppers in general are typically from higher-income bands across the age spectrum. Early adopters of Temu exaggerate his trend: they’re more likely to be older and earning in the highest bracket. In contrast, Shein attracts a younger, middle-income shopper.
LIKELIHOOD OF USERS SHOPPING AT ONLINE RETAILERS RELATIVE TO USERS SHOPPING INSTORE, SEGMENTED BY INCOME AND AGE


What is Temu’s market share?
Now that we have an idea of who is shopping at Temu, how has their spending impacted the general merchandise market in South Africa?
To answer this question, we identified a sample of 1,990 Temu customers with uninterrupted transaction data from January 2024. Doing so allowed us to draw a direct comparison with spending in the first three months of 2023.
For the users in this sample, in March 2024, we estimate that their Temu spend accounted for c30% of the total amount they spent on Home and Apparel that month. In Reveal parlance, the ‘Home’ category encapsulates General Merchandise (e.g. Takealot, Makro), Furniture (e.g. MRP Home, @Home) and DIY & Garden (e.g. Builders Warehouse, Mica).
Since Temu attracted 0% of Home spend a year ago, there have been significant shifts in how spending is allocated. Indeed, our analysis shows that the impact of Temu’s rise has been felt by most retailers in the category. In general, online-only retailers in the GM and Apparel categories, and DIY retailers, have been hardest hit.
The five retailers that have experienced the largest shifts in spending are shown in the chart on the following page. Takealot has lost the greatest spending share by far: four times the next largest.
It should be noted that Takealot attracts a significant chunk of this cohort’s spending, so it had more to lose. To accommodate this, and to give a better indication of Temu’s impact, we have also shown the percentage change in spending share between March 2023 and March 2024.
Takealot’s spending share has fallen nearly 12% – a decline of ~35% compared to a year earlier. This decline is in line with the other five retailers who all lost share to Temu
(–20–56% ). Superbalist has cause to worry: its spending share is half of what it was a year ago.
SHIFT IN SPENDING FOR TEMU SHOPPERS: DIFFERENCE AND % CHANGE IN SPENDING SHARE
(MARCH 2023–MARCH 2024)

What have we learnt?
- The number of Temu shoppers is rising exponentially.
- Early data shows that Temu shoppers are older and earn more than typical online shoppers.
- In Home and Apparel during March, Temu shoppers allocated c30% of their total spending in these categories to the Chinese retailer.
- Of all the major retailers we track, Takealot suffered the highest spending share decrease in March (–12%).
- Superbalist’s spending share is half of what it was in March 2023.

Here comes Temu
Welcome to our newsletter that provides commentary on themes emerging from our live Market Reports. Clients receive:
- Access to the Market Reports.
- An overview of general spending trends across the major retail categories.
- An analysis of changes in grocery spending over the past 12 months.
- A comparison of Reveal spending growth vs share price movement in anticipation of 1Q24 results.
As a taste of what to expect, here’s a snippet about the surge in spending at Temu – the latest Chinese online megastore.
Get the full report
Have you also been bombarded by Temu ads? Holographic 3D shirts, pyjama jumpsuits, novelty fish slippers, a fur-drying suit for your dog… The social media onslaught by the Chinese online megastore has been inescapable in recent months. It’s obviously working because – from a standing start at the beginning of 2024 – more users bought from Temu than from Shein in March.
We’ve done two detailed reports about Shein’s explosive rise in South Africa and it’s no secret that the Chinese fashion retailer is now a dominant market player. (Read Shein of the times and The road to Shein.) What does the rise of Temu mean for other general retailers like Takealot and the soon-to-launch Amazon South Africa?
We’re busy working on a detailed analysis of Temu’s growth, asking questions like which demographic is responsible for the growth in spending? And which services have those same shoppers stopped using?
Contact us if you’d like to receive the final report.
GROWTH IN CUSTOMER NUMBERS: TEMU VS SHEIN


Shein of the times
In brief
- The Chinese online retailer Shein is a major player in the South African apparel market, but many listed retail executives prefer to downplay the threat to their businesses.
- For years, our core 22seven data has shown Shein’s rise. Acknowledging that this data might not be representative of the greater population, we analysed a brand-new dataset: de-identified transactions from 20,922 new customers.
- While there are some differences in the data, there is one striking similarity: Shein’s spending share is nearly identical. This proves that the retailer’s meteoric rise is no hoax.
- Due to the low prices of garments and a relatively high free-delivery threshold, a new type of Shein shopper has emerged who aggregates purchases on behalf of individuals. But the data shows that these ‘super users’ can’t explain all of Shein’s growth: the majority of spend comes from individuals.
Things have been happening at Shein. The Chinese retailer, which is already one of the most profitable fashion companies in the world, recently moved its headquarters to Singapore, doubled its global profits to more than US$2bn, and is awaiting a stock market listing in London or New York.
We have been tracking local spending at Shein for some time. In Rise and Shein, we showed that average spending is 2–4x higher than at competitor retailers, and Shein customers also tend to be younger than the average shopper, which bodes well for future growth. The Road to Shein tracked the spending journey of a new Shein customer and highlighted the dilemma facing traditional store-based retailers: if they offer their customers an online experience, they might inadvertently train them to shop elsewhere.
Yet despite exponential growth in this country, many market players continue to downplay the threat posed by Shein. They point to anecdotal evidence of small numbers of customers in very specific demographic segments skewing the numbers. The problem is that most investors can’t challenge this narrative because they don’t have the data to support their views.
This is where Reveal steps in. By equipping investors with a large sample of actual spending data from real consumers, we can interrogate underlying market trends that are likely to influence the future prospects of listed companies. Our goal is to challenge the selective disclosure provided by company management. Company reports usually offer rose-tinted explanations of how consumers engage with the company’s brands, and they shield outsiders – investors – from emerging threats to the business. We want to equip those investors with empirical information to allow them to make better-informed investment decisions.
Let’s get to it.
A brand-new dataset
In the past, most of our spending data has come from the budgeting app 22seven. The data provides a ‘live’ view of users’ debit and credit-card spending across all South African banks and financial service providers. A perception, however, has been that it may skew towards consumers who are more digital-savvy – that it’s not representative of the greater population, in other words.
To address this concern, we recently acquired anonymous and de-identified transaction data for 20,922 consumers. Most of these are Capitec bank customers. The median income across the sample is R16,369 pm, with an average age of 31. We showcased the value of this complementary alternative dataset in last month’s report about Pick n Pay’s unbundling of Boxer.
Now we’re turning our attention to Shein. By analysing the apparel market using the two datasets, we’ll highlight differences and consistencies to prove that Shein’s growth in this country should not be ignored.
To simplify things, we’re going to call the 22seven data the Core Data, and the Capitec data the New Data.
Our analysis will look at customer spending at all apparel retailers during the four months of overlap between the two datasets: October 2023 to January 2024.
Sample size by income and age
- Both data sets are large: Core Data tracks apparel spending by 53,379 users; New Data tracks apparel spending from 20,922 consumers. In total, there are more than 480,000 transactions at apparel retailers over 4 months ending January 2024.
- Sample sizes within income brackets are also large. Core Data is overweighted in high-income brackets, yet the number of consumers in each income bracket is significant in both datasets.
- The majority of consumers are young. Sample sizes for consumers younger than 55 are substantial in both datasets.
SAMPLE SIZE BY INCOME

SAMPLE SIZE BY AGE

Market share comparison
How does spending share differ across the datasets?
First, a disclaimer: no dataset is perfect. Interrogating the two sets is not meant to show that one is better or worse than the other. Both are large samples and have different strengths; knowing the differences will enrich the interpretation of the results.
For simplicity’s sake, we’re going to highlight two income groups for this comparison: R7.5–10k pm and R30–40k pm. The charts below show market share for the two groups, followed by the retailers that show the most variance in each group.
Observations:
- Spending share for listed retailers is much higher in New Data than in Core Data. In most cases, it is closer to industry estimates of market share.
- In Core Data, ‘Other merchants’ (a grouping of smaller outlets) accounts for a greater share of overall spending.
- Unpacking the variance: Core Data reflects lower spending at major listed retailers and a greater share at mall-based retailers (e.g. Cotton-On, H&M) and online retailers (e.g. Superbalist). Controlling for income, we can infer that Core Data represents a more urban consumer: closer to malls and able to accept delivery.
- Although we only have four months of New Data, it’s clear that combining the two datasets provides a far richer view of spending and an opportunity for more detailed analysis of spending and growth. This is an exciting prospect for Reveal and its clients.
MARKET SHARE BY RETAILER

DATASET VARIANCE BY RETAILER
Market Share: New Data less Core Data

So, where’s Shein at?
For all the subtle differences in the data, the most striking observation is the similarity in one key area: Shein’s spending share in both samples is nearly identical. Both datasets still rank spending at Shein in the top five among apparel retailers.
How can that be? Customers in New Data spend much more at Ackermans, Pep and Mr Price, yet a significant portion of their spending still goes to Shein. The prevalence of online spending in both samples is probably more similar than one might expect.
This insight alone adds significant credibility to our observation that Shein is changing the landscape in the apparel market. The impact has been noted in Core Data for years and is now validated by our New Data. It would be foolish to think otherwise.
And in case you need a reminder, Shein’s enormous spending share has grown from zero in only four years.
(Side note: Superbalist is the largest online retailer in Core Data, but it features less prominently in New Data, which reflects a market share structure that is more aligned to existing industry norms.)
The rise of the ‘runner’
For such a serious market competitor, shopping at Shein is not as simple as one might expect. Since all items are manufactured in China and shipped from there, delivery times are slow and customs fees come into play. Similarly, returning items is a headache.
There’s also the issue of the free delivery threshold. For a company shipping from China, the R600 threshold is actually quite low, but some of the garments are so cheap that it’s difficult to reach that threshold. (Deliver costs R150 for orders less than R600. By comparison, Superbalist delivery is free for orders over R500 and R60 for orders under the threshold.)
Shein’s R600 minimum order has given rise to a new kind of online shopper – a reseller or ‘runner’ who leverages social networks, WhatsApp and increasingly affordable local courier services to order from Shein on behalf of others for a small surcharge. Here’s an example on Facebook Marketplace and Instagram.
Are these runners, with their increased shopping frequency and higher basket spend, contributing meaningfully to Shein’s market share?
Again, we looked at the numbers.
Our evidence shows that 6% of Shein customers purchased more than five times from the retailer in the four-month period under analysis. Yet despite their relatively small numbers, these outliers account for 26% of spending at Shein in the Core Data, and 16% in the New Data.
That sounds like a lot, but it only helps if we compare the figures to a competitor retailer. All retailers have ‘super users’, the question is whether Shein’s are markedly different.
Let’s look at Mr Price and Ackermans, both of which also had shoppers who purchased more than five times during the period. At Mr Price, those regular shoppers accounted for 21% of spending – a share almost equal to Shein’s regular shoppers. However, as the purchase frequency increases, the contribution of these super users decreases at Mr Price and Ackermans compared to Shein. At 10 purchases per month, Shein’s super users spend 3x more than Mr Price’s and 9x more than Ackermans’.
But these super users alone aren’t enough to explain Shein’s tremendous success. If we assume that Shein’s super users account for 9% of spending value, then Shein’s adjusted market share is ~6.3% instead of ~7%, which is still a major chunk. Therefore, even though there is evidence of so-called ‘runners’ boosting Shein’s spending share, it’s safe to say that they vast majority of spending still comes from individual shoppers.
PROPORTION OF TOTAL SPEND FROM CUSTOMERS WITH MORE THAN 5,10 OR 20 TRANSACTIONS DURING THE PERIOD

What have we learnt?
- Despite a complicated delivery and returns process, consumers in South Africa, including those in lower-income bands, have not been deterred from shopping online at Shein. This mirrors a trend that has been observed worldwide.
- 'Runners’ or aggregators are more prevalent among Shein shoppers, but these high-spend users are not solely responsible for Shein’s outsized success over the past four years.
- Shein’s low-price fashion offering speaks to a gap in the market. South Africa is not protected by lower average incomes or logistical complexity.
- Given that the market shift has happened so rapidly, and data in the public domain is relatively opaque, it is understandable that apparel executives may downplay the threat. But the threat is valid, as we have now demonstrated across two large samples of real transactions from more than 70k actual consumers.

Boxer steps into the ring
In brief
- We analyse a new dataset of transactions from 27,182 Capitec customers.
- Boxer has a ~9% spending share among customers earning less than R15k pm.
- Boxer achieves the second-highest average transaction value among its competitors, but the lowest transaction frequency.
- Boxer’s discounter model seems to limit the proportion of grocery spending it can capture from individual shoppers.
- Store count will continue to be the dominant growth driver for Boxer.
- A stronger PnP may be a challenge to Boxer, and a separate Boxer introduces additional complexity for minority shareholders…
Pick n Pay is in serious trouble. In February, the group announced plans to raise R4bn from shareholders and to list a portion of its best-performing division: Boxer.
At Reveal, our goal is to use alternative data to give investment analysts a deeper understanding of their investment universe. This universe may soon include Boxer.
That said, our traditional spending data is generally representative of a higher-income customer and doesn’t offer the best view of a Boxer shopper, who is typically from a lower-income bracket.
So, we went shopping…
We acquired anonymous and de-identified transaction data for 27,182 Capitec customers from a service provider that facilitates KYC validation for lenders, mobile operators, municipalities, landlords and the like.
The median income across the sample was R16,369 pm, with an average age of 31. (We calculate income as the average cash inflow per month to the account.) As the charts below show, the sample is large and well balanced, with a good spread from very low to very high-income earners.
SAMPLE SIZE BY INCOME BRACKET

SAMPLE SIZE BY AGE

When it comes to transactions, there are 19 million in the sample. From those, we extracted 575,600 purchases at Boxer, Shoprite, Checkers, Usave, PnP and Spar, over the four months ending January 2024.
Our research has historically focused on national retailers like those listed above, but the topic and the data allowed us to explore spending at less-formal grocery and food merchants, too. These include spazas, superettes, cash-and-carry stores and other grocery retailers.
The exact number and make-up of the merchants in this category are difficult factors to evaluate. Stores range from significant competitors like KitKat Cash & Carry, to hundreds of small spazas and supermarkets like Hamza Supermarket near Mbombela. (Click the link. It’s worth it.)
We refer to this collection of stores as ‘Less Formal’ because:
- It’s not a collection of purely informal traders, so it’s more accurate;
- There’s a range of reasonably large and very small stores;
- The category excludes cash transactions. By design, our data only reflects swipes or taps. Cash-only stores are generally informal in nature.
In total, purchases made by 12,600 customers at these less formal retailers added a further 82,247 transactions to the total transaction sample.
Across the whole sample, customers spent anything between R500 and R2,800 each month at the merchants considered in the analysis. Compared to the midpoint of their income bracket, this equates to 5–21% of their grocery wallet.
MONTHLY SPEND BY AGE AND INCOME BRACKET

SPEND AS A PROPORTION OF INCOME BRACKET MID-POINT

Observations:
- A 30-year-old customer earning ~R6,000 pm spends roughly 10% of her income (R691) at the retailers included in this analysis. By contrast, her contemporary earning ~R17,500 pm spends 7% of her income at these stores (R1,306). From the outside (I’m not that young!) these amounts appear low. But remember that this is not an exhaustive analysis of every possible channel of purchasing groceries – there will be some spending at merchants not included. And, importantly, our analysis excludes all cash purchases.
- Income is a more significant determinant of total spending than age. The average change in spending across successive age brackets is 6.5%, whereas the change across successive income brackets is 25%.
- This analysis does not include Woolworths because transaction data is unable to distinguish between clothing and food-related purchases. Woolworths’ clothing division is skewed towards a lower-income consumer but their food division is not. Since this report is focused on lower-income grocery spending, including spend at Woolworths would increase the food spend of higher-income consumers even further, creating an even more extreme contrast between lower and higher income brackets.
Who shops at Boxer?
Boxer’s operating model differs from PnP’s. As a grocery discounter, it offers a comparatively narrow range of products – about 3,000 compared to 8,000+ in a typical PnP supermarket – with the commitment that these products will always carry the lowest price.
Even though Boxer has outperformed PnP’s core supermarket business for many years, it has only recently been separately reported on. Now that shareholders can disentangle Boxer from the core, we can see that the chain has reported sales of R34bn for the 12 months to Aug 2023. During the same period, the division posted growth of 17.1% – 11.9% of which came from expanding the store footprint.
The chart below shows the grocery spending share split for the 27k customers in the sample, by age and income bracket, at the six grocery chains in the analysis, as well as at the less formal stores.

Observations:
- Boxer’s share of total spending is greatest among low-income consumers (~10%) and it decreases consistently as income increases. Spending share is relatively stable (~9%) among customers earning less than R15k pm and declines more rapidly in higher-income brackets.
- In general, spending share is relatively stable across age brackets.
A key factor that determines market share is average transaction value (ATV), or ‘basket value’. ATV is an important driver of profitability: given mostly comparable products, all else equal, the more a customer spends per visit, the greater the absolute profit.
The following charts compare average transactions. In the first, we hold age constant and compare across income brackets. In the second, we compare across the age spectrum.
AVERAGE TRANSACTION VALUE BY INCOME BRACKET: CUSTOMERS AGED 25-35

AVERAGE TRANSACTION VALUE BY AGE BRACKET: CUSTOMERS EARNING R7.5–10K PM
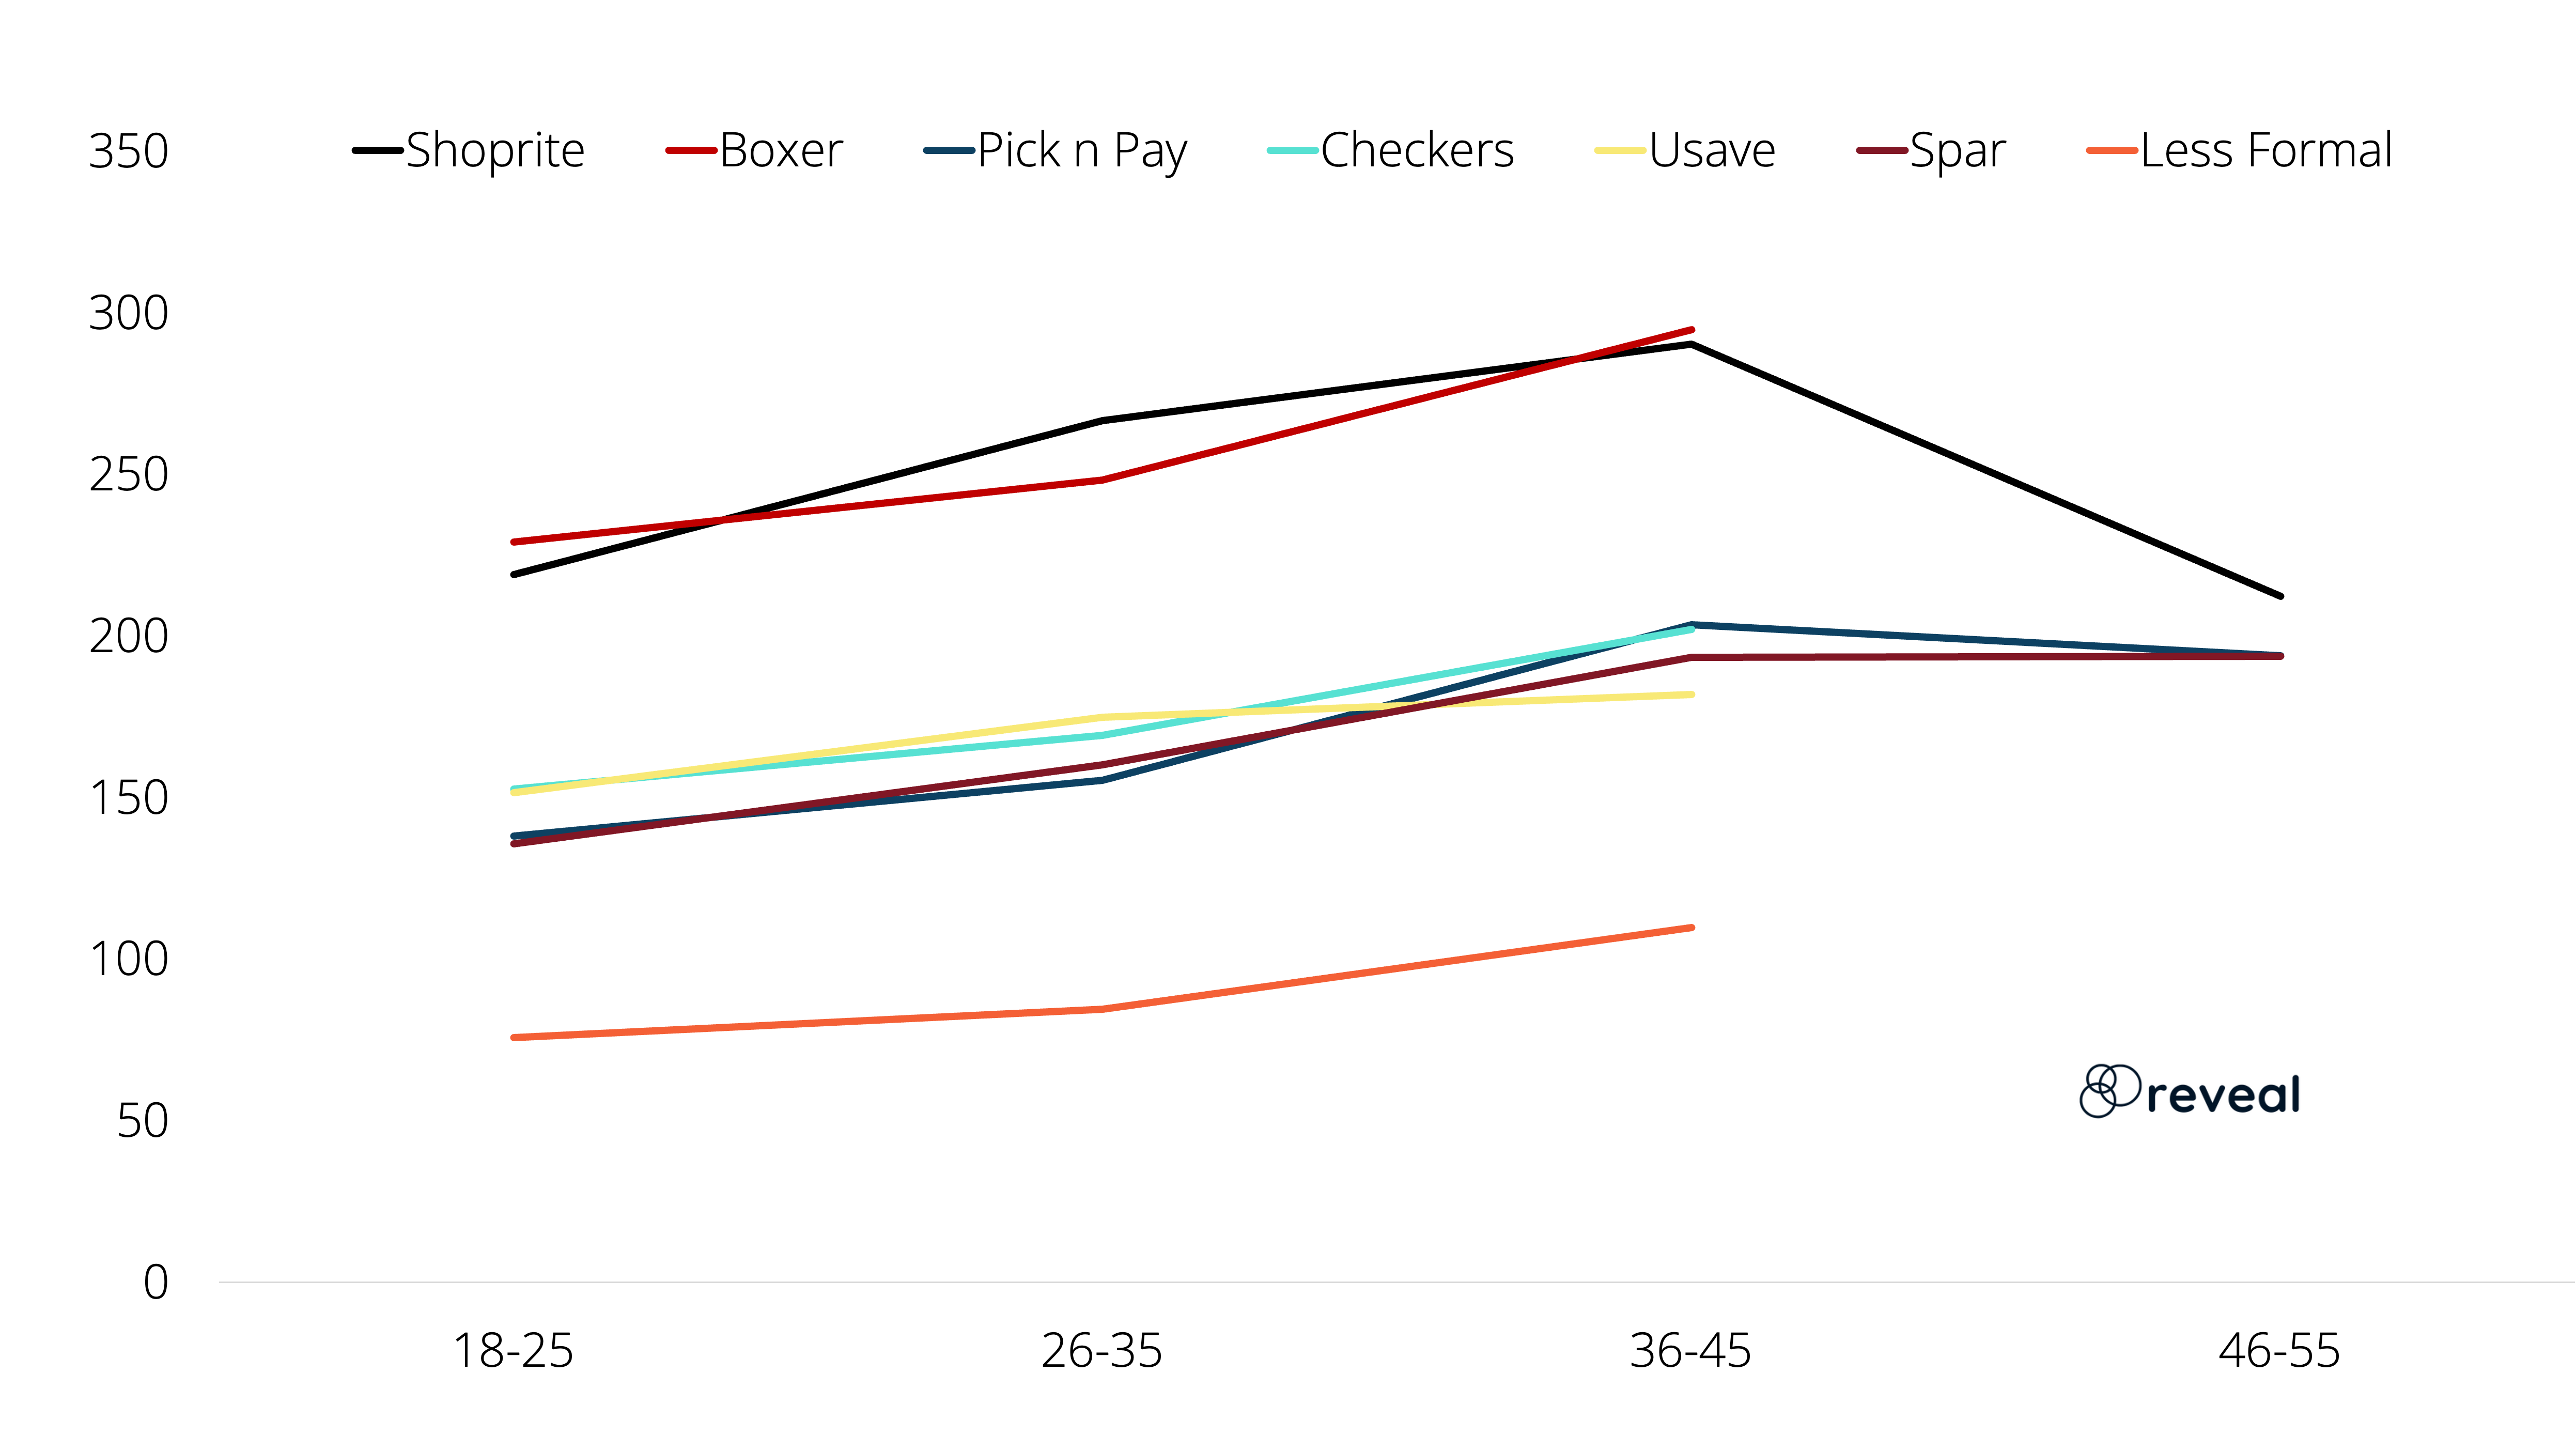
Observations:
- ATV across the board increases as income increases. When it comes to age, ATVs peak among customers in the 35–45 bracket and then decline.
- In general, Shoprite has the highest ATV for each income and age bracket.
- Boxer’s ATV falls between Shoprite and Checkers for the age bracket shown, but in other age brackets, Boxer has the highest ATV.
- In most income brackets, PnP’s ATV is the second lowest, behind Usave. Its position improves among older customers, although there are more gaps in the data and fewer comparisons.
- Transactions at less formal stores have the lowest value on average.
Now let’s segment market share for a major cohort of Boxer shoppers aged 25–35 with incomes ranging from R7.5–R10k per month.

Controlling for age and income, this tells us:
- Shoprite attracted the most shoppers in this segment, followed by Spar (-5%) and PnP (-13%)
- At R248, Boxer’s ATV is just 7% lower than Shoprite’s, whereas other major retailers’ ATVs typically range between R155 (PnP; -42%) and R175 (Usave; -34%). This is a positive for Boxer, given that it’s a limited-range discounter and Shoprite is a full-range supermarket.
- Boxer has the lowest purchase frequency (1.7x month) – slightly lower than Usave. Customers shop most often at Spar (2.5x) and at less formal stores (2.4x).
- This method of decomposing market share is useful to highlight the different ways that customers engage with a retail chain. Look at Shoprite and Spar, for example. Both serve a similar number of customers (Spar 5% fewer); Shoprite attracts a much higher ATV (+60% vs Spar); while Spar customers shop 24% more often. The result is that Shoprite’s market share is 42% higher than Spar’s
- [42% = (1-0.05) *(1-0.4)*(1+.24) - 1].
To sum up this section, we’re positively surprised by Boxer’s average transaction value. As a limited-range discounter, customers spend almost as much at Boxer stores as they do in Shoprite supermarkets, which have a much wider product offering.
How does store count affect these numbers?
Boxer has a smaller store footprint than competitors like Shoprite, which is reflected in its lower market share. Surely it just needs to grow its store footprint then?
It’s not that simple. Based on the latest store lists from each retailer’s website, we estimate that Boxer has 281 superstores. (For the purposes of this analysis, we’ve ignored other store types in the count, like liquor, clothing, building etc.) Shoprite (577), PnP (617) and Spar (940) all have much larger store bases.
It’s also common to hear about provincial strongholds in the retail landscape. Boxer’s origins are in KZN and it has the most stores in that province, with comparatively few in Gauteng and the Western Cape.
Side note: we’re surprised that Spar doesn’t have a greater bias towards KZN. It’s often suggested that Spar has a strong reliance on this province, but its store distribution does not suggest any greater reliance than its major competitors.

How do we take the provincial differences in store bases into account? Do we even need to? Maybe, instead of focusing on all customers, let's narrow the focus to customers who shop at Boxer and at the other retailers, and compare the relative proportion of their grocery spending. Put differently, someone who shops at Boxer must be close to a Boxer store. Can we compare how these users shop at Boxer to how other customers shop at other stores?
To visualise this, let’s keep age constant and consider customers in the 25–35 bracket. The chart below compares the proportion of total spend at each retailer. We call this 'loyalty’ – a customer's share of total spend at a retailer.
For example, customers earning less than R5k per month, who shop at Shoprite, spend 45% of their total spend there. (The chart shows that Shoprite attracts the largest proportion of total spend across all income groups.)
LOYALTY BY RETAILER: CUSTOMERS AGED 25–35

At a glance, the chart appears similar to the market share charts above, but it’s actually showing something quite different: how much a customer spends at a retailer, relative to all the other retailers they also shop at.
Let’s go to Boxer again as an example. We’ve already shown that Boxer’s market share across all income demographics is ~9-10% (p 4) – this chart shows that Loyalty among its customers ranges from 25–35%.
(It’s worth considering the number of customers shopping at each retailer. Although this chart shows that Boxer’s loyalty is relatively stable across income brackets, earlier charts showed that its market share falls abruptly in brackets above R15k pm. The implication is that the number of customers who shop at Boxer in those brackets falls rapidly. The loyalty shown above simply demonstrates that the few wealthy customers who do spend at Boxer, spend c20% of their total grocery wallet in the store.)
It's interesting that for the two lowest income brackets, Boxer’s loyalty is most like Usave’s and the Less Formal retailers. Usave is also a low-cost, limited-range discounter; and although the ‘Less Formal’ category is comprised of many individual retailers, the spazas and superettes there are more likely to fall into same category of discount retailers than wider-range supermarkets.
It’s encouraging that the data shows such high consistency between these retailers at the lower-income end of the market. More importantly, it affirms the role that a limited-range discounter fulfils for its customers. By offering only a limited range, these retailers cannot fulfil as many needs as a wider-range supermarket. A limited range can boost profitability… By aggregating demand within a product category, operations can be simplified and volumes can be boosted, along with the retailer’s purchasing power with suppliers. But loyalty to a discounter will always be lower.
With a loyalty at 40%+, Shoprite sets the standard in this space. But the data shows that even PnP has higher loyalty in lower-income categories than Boxer and Usave. (It is known that PnP has different ‘types’ of stores under the single brand, something it was trying to solve under Project Ekuseni.) This supports the notion that loyalty to a discounter can probably be capped at ~30%.
Finally, look how similar shopper loyalty is for PnP and Checkers in the income brackets between R15-60k pm, where its supermarket formats are most competitive.
To sum up this section, our analysis suggests that Boxer performs very well in the market that it operates in. But with a limited range of discounted products, the retailer is ‘boxed-in’ when it comes to how much spending it can attract from customers.
With that in mind, it’s unlikely that Boxer will be able to capture a significantly larger spending share from customers who are already shopping at its current stores.
So, will unbundling Boxer save PnP?
This analysis demonstrates Boxer’s pedigree as a retailer. Lower-income customers spend as much at Boxer as they do at Shoprite, which is the market leader in this category. However, as a limited-range discounter, Boxer is approaching natural thresholds as to what this retail format can extract from its customers. Store growth will therefore continue to be the most significant driver of growth.
Boxer has 70% as many stores as Usave, the most obvious discount competitor, and 50% as many as Shoprite. If store growth continues at ~10% pa, then space may be a reliable avenue of growth for Boxer for the next three to five years. A much larger store base will require a much more expansive supply chain.
Supply chain and minority investors
The analysis has yet again shown how formidable the Shoprite Group is: three distinct brands with targeted consumer segments and differentiated retail models, each leveraging a single, integrated supply chain. The scale of this supply chain drives efficiencies that are reinvested elsewhere to continuously improve those efficiencies.
On the other hand, we understand that PnP and Boxer operate relatively separately, with different distribution infrastructure, logistics, merchandising and other functions. The allure of Project Ekuseni was that it attempted to replicate Shoprite’s strategy of three different consumer propositions and the possibility of the supporting supply chains to integrate, which could have led to a more efficient, profitable business.
PIK (to distinguish the group from PnP supermarkets) now plans to list a minority shareholding in Boxer to raise capital. We believe this would introduce complexities for minority Boxer shareholders when it comes to the dark art of allocating returns associated with a retailer’s supply chain. For example, how will a minority shareholder in Boxer know whether rebates by suppliers of products sold by Boxer are fully allocated to Boxer, as opposed to cross-subsiding PnP purchases from the same supplier?
Is growth zero-sum for PIK?
We’ve written extensively about the market share shift from PnP to Checkers among higher-income consumers. But PnP’s challenges are not limited to this segment alone. This analysis is a reminder that PnP’s weakness is a boon to other retailers, including Boxer, which has likely been (and continues to be) a major beneficiary.
Investors backing a recovery at PnP should acknowledge that this might impact Boxer’s growth prospects. In a consumer market without any real growth, a better-performing PnP implies slower growth for Boxer…
What we know now
Our original mission was to leverage alternative data to learn more about Boxer. In doing so, we’ve shown that Boxer trades well against the market leader in lower-income consumer categories. As a discount retailer, there is some evidence that Boxer is reaching the limits of what its model can offer existing customers. Expansion into new territories is a viable growth driver for Boxer over the next few years.
A larger store base will require Boxer to build a more complex supply chain, most likely into territories where PnP already has infrastructure. More sharing of infrastructure may be required and is perhaps necessary to match peer-group efficiencies. However, a separately listed Boxer raises questions about how the costs and returns of building and operating an integrated supply chain will accrue to minority investors.
Finally, in a weak economy and a relatively concentrated market, analysts should be careful not to double-count growth going forward. Boxer has grown ahead of the market in the past, partly because PnP has lagged. Going forward, if investors believe in a PnP recovery, the outlook for Boxer must be more modest.

The pet worth of Woolworths
In October last year, Woolworths announced that it had acquired 93.5% of Absolute Pets – a chain of retailers selling pet food, toys, healthcare goodies and accessories.
It’s no secret that the pet category is growing quickly in South Africa. In 2022, the market was estimated to be worth more than R7 billion. That same year, we showed how 22seven users who owned pets spent an average of R1,213 per month on their upkeep. That figure has certainly increased.
Despite the range and variety of pet products having expanded exponentially in recent years, the market remains fragmented and therefore attractive to bigger retailers who are jumping at the opportunity to build out chains of pet stores and consolidate consumer spending.
The Shoprite group was first in 2021, when they launched their stand-alone Petshop Science stores. And now Woolworths has joined the fray, hoping Absolute Pets will accelerate the retailer’s existing pet strategy.
To analyse the merits of this strategy, we did a deep dive into the spending habits of 22seven pet lovers at more than 360 pet and vet stores nationwide – not just the ones that sell food, healthcare, grooming and play products, but also services like grooming and kennels. (Unfortunately, we don’t have a view of how much is spent on pet food bought directly from grocery stores and other general retailers.)
The objective of our research is twofold: to help our clients better understand the business that Woolworths has acquired; and to contemplate what that business might become by analysing the market in which it operates.
Prime my pup
Let’s start with Absolute Pets as a standalone entity. It’s an impressive business – by far the largest specialist pet retailer that we can identify from the 360+ pet and vet stores frequented by 22seven users. Accounting for 29% of total pet spend over three months to December 2023, Absolute Pets is 3.8x the size of its next largest competitor: petzone, part of the West Pack Lifestyle group.
The chart below shows the nine largest pet retailers by spending share. Together, those nine account for c70% of total spending on pets. The remaining retailers account for c30% of spending share, demonstrating just how fragmented the market is. (Absolute Pets accounts for the same percentage as the entire ‘Other’ category, made up of 300+ smaller stores, vets and pet services.)

But wait, there's more...
The full report is available to clients – showing comparative spending across the major pet retailers and where Woolworths might be able to find real growth in its acquisition. If you would like the full picture, contact us to learn how you can pay for research via your broker or subscribe directly.

Which retailers grew spend in December?
You’re reading the free version of Shop Talk. Some company-level findings have been removed or masked to be fair to subscribers. If you would like the full picture, contact us to learn how you can pay for research via your broker or subscribe directly.
As we described in this week’s Nugget, November and December are especially important months for retailers. In certain categories, combined, they account for nearly 25% of annual spend, even though they comprise only 17% of days in the year.
It’s common for listed retailers to provide trading updates to the end of December – these announcements are likely to start being published next week. To get ahead of the game, we’ve analysed the debit and credit card transaction data of a large sample of real consumers to estimate the spending growth that these retailers may announce over the coming weeks.
Less cheer than last year
In general, our data shows that consumer spending growth continues to weaken. Spending growth slowed in December in most categories. There were some categories (like Eating Out, Pharmacy and Grocery) that increased ahead of total spending growth, but others (like Apparel, Media and Home) lagged behind. Across all categories, spending on Apparel slowed most in December.
December 2022 saw much higher rates of spending growth, making it harder for consumer-facing companies to maintain their growth momentum, especially since the trading environment hasn’t become any more favourable.
Growth in spending by category (22seven users)

Bringing it together for the listed retailers
In anticipation of January trading updates from the major retailers, one method of consolidating the info gained from spending growth data is to compare spending growth with share price movements.
There are many ways to do this. In the chart below, we contrast the change in share price since early December (45 days; relative to the JSE General Retail index) with the three-month, year-on-year growth in spending. We provide this for each retail brand and its listed parent. For example, you’ll notice that PnP supermarkets (PIK – PnP) is shown separately from Boxer (PIK – Bxr) to highlight differences within companies. We do the same for Shoprite and Pepkor.
In this view, we’d expect points to be clustered along a diagonal trendline through the origin. (We’ve plotted this to make it less imaginary.) While there are other permutations of period and metric that could be plotted, and a multitude of other considerations to take into account, our attention is focused on the companies and brands that lie furthest from the straight line.

Want to see where the major retailers fall on the chart? Contact us to find out more. Clients can also request the underlying spreadsheet to evaluate their own permutations of data in this chart.
Showmax, slowmax
Lastly, if you’re a media company reliant on a sports audience, it may be hard to grow when the past 11 months have included three major world cups!
For instance, annualising the dividend from the FIFA World Cup in late 2022 seems to have meaningfully knocked spending on Showmax in November and December 2023. For spending in this category to return to growth, we may need to wait until the end of 2024 for the benefits gleaned from the rugby and cricket world cups to have fallen out of the base period. Especially considering that spending on DStv weakened during the last six months, notwithstanding the boost from the two world cups, which has dragged overall spending in the category lower.
Spending growth on media and streaming services (22seven users)


A Black Friday to remember
Welcome to our newsletter that provides commentary on major themes emerging from the Insights' dashboards. This month, we dissect November's Black Friday spending frenzy...
Black Friday has come and gone. The spending jamboree helps make November the second most important month in the retail calendar after December. In a handful of categories, it’s the most important month of the year.
With that in mind, it’s valuable to know which retailers are doing better than others, since they’re all competing for their share of consumers’ year-end spending.
We begin with a top-down view, looking at user spending by category, before focusing on the winners and losers during the month of Black Friday and two other significant observations that make November an even more noteworthy month for South African retail.
Wins for discretionary spending categories
Despite the November spending frenzy, the rate of annual spending growth by 22seven users in most retail categories is unchanged compared to last month. For example, spending in the Grocery, Pharmacy Retail and Eating Out categories grew at mid-single-digit rates, while the amount spent on Apparel was relatively unchanged compared to last year.
The most significant change in growth occurred in the Home category, which captures user spending at ~100 retailers across sub-categories spanning General Merchandise, Furniture & Homeware and DIY & Garden. User spending in these more discretionary categories has been in decline throughout 2023, but the rate of decline nearly halved during November. This improvement was mostly driven by better performance in the Furniture & Home sub-category.
Growth in spending by category (22seven users)

Black Friday winners and losers
We argued last year that a retailer’s Black Friday performance should actually be measured across the entire month of November because so much promotional activity takes place in the weeks leading up to the actual day (24 November this year).
The chart below shows the year-on-year growth for different retailers in November across the Grocery, Apparel, Home and Pharmacy categories. Boxer delivered the strongest improvement in the Grocery category, while spending at its big brother Pick n Pay declined compared to last November. 22seven user spending at Pharmacy retailer Dis-Chem increased faster than spending at Clicks.
The standout performer in Apparel was Shein (see the next section for more detail) while spending across the rest of the category increased at modest rates.
In the most discretionary category, Home, which includes electronics and furniture retailers where Black Friday discounts on big-ticket items can be more persuasive, @Home delivered a very strong performance. Spending at Takealot also increased – off a very high base in 2022 – to achieve its highest ever share of total spending in the category.
Annual growth in spending by category and retailer: November 2023

What’s so memorable about this?
Not much, maybe it’s just another month. Except that Shein and asap! (and their competitors) might be interested in some important milestones achieved during November…
We’re delighted you’ve read this far. But research is only valuable if it’s exclusive. To be fair to the retailers and investment teams who subscribe to Insights, we have to say goodbye before we get to the juicy bits. Contact us to find out how our research can help you: Simon Anderssen simon.a@22seven.com +27 84 730 0309

Do the drugs still work?
Our objective at 22seven Insights is to equip investment and market analysts with alternative data that helps inform investment decisions. Today, we’re delighted to add Pharmacy Retail to the list of consumer spending categories available to subscribers.
Broadly defined as any purchase by a 22seven user at Clicks, Dis-Chem, Pharmacy @ Spar, MediRite or a long list of other pharmacies and apteeks across the country, the retail pharmacy market is more concentrated than any other category we track. Just two companies account for ~90% of 22seven user spending in this category.
This might raise a red flag for growth within the relevant listed companies, but at another level, the idiosyncrasies of this category could mean that 22seven’s view of the level of market share is overrepresented. However, as we’ll demonstrate later, market trends within this category and our depth of data both offer rich insights.
The key difference in the Retail Pharmacy category is that the customer is not always the one paying: medical aids and insurers often fund a customer’s medicine purchases from a pharmacy. The retailer reports this transaction as a sale but the transaction doesn’t appear on a user’s bank statement.
As a result, 22seven’s ability to track the rate of sales growth at pharmacies is compromised. This is evident in the correlation between growth in 22seven user spending at Clicks and Dis-Chem, for example, and the companies’ reported sales growth. Compared to the high correlation for major grocery retailers, correlation in the retail pharmacy sector is poor.
Correlation between Insights’ estimate of user spending growth and retailers’ reported interim sales growth

Instead, our data is more reliable in tracking the retail performance of sub-categories within these pharmaceutical groups. As the next chart shows, growth in 22seven user spending at Clicks correlates more strongly in sub-categories where customers typically pay themselves – such as Beauty, Personal Care and General Merchandise – than in categories where medical aids or insurers are more likely to pay for the products.
Correlation between Insights’ estimate of user spending growth and Clicks’ category growth

Finally, it is our observation that Clicks and Dis-Chem have a much larger offering of non-dispensary retail categories, on average, than other pharmacies. Therefore, the relative contribution from these ‘front shop’ categories, where customers pay directly, may also play a role in explaining Clicks and Dis-Chem's exaggerated level of spending share in the data.
When we look at market share trends, however, Insights’ data offers a unique view of a large sample of customer spending decisions at these two retailers, on products that represent at least 70% of Clicks and Dis-Chem’s reported sales. In this note, we describe some of the key trends over the past few years.
You play high, I play low
Market analysts will be aware that the retail pharmacy industry is 20+ years into a period of consolidation. Catalysed by amendments in 2003 that allowed corporate ownership of pharmacies for the first time, many health and beauty retailers began opening in-store dispensaries, often within malls, and acquiring independent pharmacies. Some independent pharmacies established groups or other structures to amass scale to compete against the retail juggernauts.
Based on the analysis of 22seven user spending, and taking into account the caveat regarding spend versus sales, our data reflects a retail pharmacy market that consists of two very large retailers – Clicks and Dis-Chem – and a long list of individual pharmacies or smaller chains that we’ve grouped into the category, ‘Other’.
These Other pharmacies include chains like Pharmacy @ Spar, Shoprite’s Medirite, Dis-Chem-tied The Local Choice, and Alphapharm etc. Relative to Clicks and Dis-Chem, the number of transactions at each is too small to show these chains separately, although we can do this on client request. Spending in Other also includes transactions at a sizable number of independent pharmacies.
In 3Q23, Clicks and Dis-Chem accounted for 89% of all user spending at retail pharmacies, with Dis-Chem (44.9%) attracting slightly more spend than Clicks (43.9%). On reported numbers, Clicks is actually a bigger business: ~10% larger than Dis-Chem based on total retail sales and ~23% on non-dispensary sales.
22seven users' share of spending at retailer pharmacies in 3Q23

Our data reflects this relationship among lower-income shoppers. As the table below shows, spending share at Clicks is larger than Dis-Chem’s among users earning less than R15k pm, while Dis-Chem attracts more share from higher-earning customers.
Spending share by income bracket in 3Q23

When we evaluate changes in market share over the past two years, we find that both Clicks and Dis-Chem have done better in the segments where the other is more dominant: Clicks gaining in the higher-income market, for example, and Dis-Chem gaining among lower-income users. In general, pharmacies in the Other category have been shedding spending share.
Change in spending share by retailer and income bracket over two years to 3Q23

A different formula
The data also shows that Clicks and Dis-Chem accumulate their market share in slightly different ways. Consider the R15-25k pm income bracket, where spending share is most similar across the two groups. Segmenting this market share into three factors highlights the differences. These factors, shown in the next chart, are:
- Number of users
- Transactions per user per month
- Average transaction value
Segmenting spend for users earning R15k–25kpm

From this chart, we can see that Clicks attracts 30% more users each month than Dis-Chem does. These users visit the stores slightly more often (4%), but they spend 26% less per visit. In other words, higher transaction values at Dis-Chem compensate for fewer customers and a lower purchase frequency. These trends are similar in other income brackets.
The key challenge for the retail pharmacies in the Other category is that they attract so few customers. For example, relative to Dis-Chem, these pharmacies attract just 43% of the number of customers that Dis-Chem does. Those customers shop 13% less often and spend 27% less each visit.
Thinking about growth
Our data might present an imperfect view of the entire retail pharmacy market, skewed towards the non-dispensary portions of these businesses, but for retailers trading on weighty market multiples, it would be foolish not to consider how this data can be used to evaluate future growth for Clicks and Dis-Chem.
Clicks and Dis-Chem each report market share in their pharmacies of ~24%. It’s possible, therefore, that there may be significant market share to be gained in this category in the future – and associated opportunities for supplier incentives.
But perhaps the differentiated view provided by our analysis is that Clicks and Dis-Chem both have a significant share of everything else sold in their stores. For context, non-dispensary categories account for 72% and 64% of sales at Clicks and Dis-Chem respectively. We estimate this to be worth roughly R41bn in annual sales.
Undoubtedly, Clicks and Dis-Chem are specialists in these non-dispensary categories, many of which are niche, and they have extensive product ranges featuring popular private brands. But it’s also true that most of the non-dispensary products can be purchased elsewhere. Furthermore, these products generally have a long shelf life and they’re often recurring purchases, which makes them perfect for online delivery.
Clicks and Dis-Chem report market share in non-dispensary categories between 20 and 50%. Clicks is most dominant in ‘Skincare’ (43.6%) and Dis-Chem claims 47% of ‘Healthcare and Medical’. We wouldn’t be surprised if the suppliers of these products felt uncomfortable with these levels of market share concentration.
The ‘Baby’ category has the lowest share for each retailer. To our knowledge, every listed retailer, except for Pick n Pay and Spar, has ventured into a standalone Baby format in the past five years.
The challenge for Insight to conduct a more thorough analysis of non-dispensary spending is that each sub-category has a different set of competitors. For example, many apparel retailers compete in Beauty and Skincare, while Takealot and Makro are go-to destinations for purchases in the Small Appliances sub-category.
If we were to pick one group of competing retailers with a product range that most overlaps with Dis-Chem and Clicks, it would be Grocery Retail. Again, however, each grocery retailer defines its competitor set differently: some include pharmacy retailers; others don’t.
This tells us that there isn’t agreement on how grocery retailers target the overlap in product categories like Personal Care, Vitamins and Health, Nutrition, Home Cleaning and Small Appliances.
Should grocery retailers focus more on these categories?
To explore this question further, we looked at how often a 22seven user transacted at a grocery retailer and a pharmacy retailer on the same day during the three months ending September 2023. For instance, what is the likelihood that a Checkers shopper will also shop at Dis-Chem on the same day?
Just as a retailer might evaluate the sales uplift from different combinations of products inside a store, such as whether to put the crisps next to the Coke on a gondola, or alongside a fridge of braai meat, this analysis attempts the same approach by evaluating combinations of purchases between stores. Our thinking is that a customer purchasing from two stores that both sell the same products on the same day suggests that the customer was unsatisfied by at least one of the retailers.
This perspective of shoppers' actual buying behaviour is rare and reveals the growth opportunities for...
We’re delighted you’ve read this far. But research is only valuable if it’s exclusive. To be fair to the retailers and investment teams who subscribe to Insights, we have to say goodbye before we get to the juicy bits.
Contact us to purchase the full report or to find out how our research can help you.
Simon Anderssen
simon.a@22seven.com
+27 84 730 0309

On-demand hits prime time
Our monthly Shop Talk newsletter provides commentary on major themes emerging from the Insights dashboards. This is a truncated version – contact us to become a subscriber and you'll receive the full report.
This month, we turn our attention to the Grocery category…
As rugby fans are well aware, Checkers Sixty60 is spending big money as a leading sponsor of the Rugby World Cup broadcasts, which began in early September on DStv’s Supersport.
In Checkers' 360, we concluded that it would be very difficult and costly for any competitor to unseat Sixty60, given how dominant the service is in the on-demand category. But Pick n Pay asap! seems to be trying… They’re the leading sponsor of the Cricket World Cup broadcasts on Supersport, which started in early October. Yes, there are delivery scooters all over our TV screens right now!
We haven’t seen any asap! ads with highly-paid pundits commentating on braai techniques (yet) but it is noteworthy that the Pick n Pay advertisements do not feature the partnership with Mr D that was launched with much fanfare this time last year. In other words, although customers can still order Pick n Pay groceries through Mr D, it seems the group is also pushing ahead with asap! as a standalone offering. This makes sense, to us at least, but it calls into question the original strategic decision to dilute control over this driver of growth in the first place.
When it comes to analysing performance, it’s difficult to split the asap!/Mr D partnership from Mr D’s existing business. What we do know is that Mr D has outperformed its main rival, Uber Eats, over the past 12 months. If we attribute this difference in performance to asap!, then we have a generous assessment of asap!’s adjusted performance over the past year.
Even so, it’s not flattering, especially when compared to the towering example of Sixty60. This might also explain why Pick n Pay is pivoting to take back control of their on-demand service.
On the other hand, the marketing spend allocated to this battle is a small respite for DStv executives, who have had a horrid year…

We’re delighted you’ve read this far. But research is only valuable if it’s exclusive. To be fair to the retailers and investment teams who subscribe to Insights, we have to say goodbye before we get to the juicy bits.
Contact us find out how our research can help you.
Simon Anderssen
simon.a@22seven.com
+27 84 730 0309

Ready to unlock new insights?
One of the team will get in touch soon!
